Download
1 / 46
460 likes | 606 Views
The Student Transitions Project (STP): Collaborating Across Education Ministries and Institutions to Track Grade 12 Graduates Enrolling in B.C. Public, B.C. Private and Non-B.C. Post-Secondary Institutions. Presentation for the CIRPA 2010 CONFERENCE By Joanne Heslop, Manager

E N D
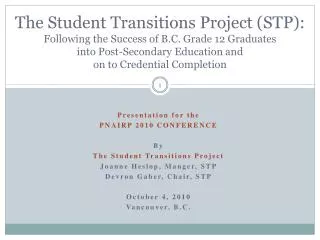
The Student Transitions Project (STP):Collaborating Across Education Ministries and Institutionsto Track Grade 12 Graduates Enrolling in B.C. Public, B.C. Private and Non-B.C. Post-Secondary Institutions Presentation for the CIRPA 2010 CONFERENCE By Joanne Heslop, Manager Student Transitions Project (stp) October 26, 2010 Ottawa, ON
AGENDA STP BACKGROUND Student transitions Student mobility Student success
STPBACKGROUND HISTORY PURPOSE METHODOLOGY
Student Transitions Project (STP) • STP began in 2005. • Collaborative research effort across B.C.’s Education systems. • B.C. Council on Admissions and Transfer (BCCAT) is also a partner in STP research. • Used for strategic planning at various levels of education in B.C.: • school districts, • post-secondary institutions, • government.
Student Transitions and Mobility STP tracks education transitions and pathways of students: From K-12 to post-secondary, • AND • Within the post-secondary system. Using 2009-10 institution types
Student Transitions – How? Personal Education Number (PEN). Without the PEN, there would be no STP. All students entering K-12 in B.C. are assigned a nine-digit number. This unique identifier follows students throughout their education in B.C. STP links the PEN between the education systems to track student transitions while protecting personal privacy. This is key to our ability to track student movement over time. Strong Start Kindergarten University Grade 12 Graduate College 987321432 987321432 987321432 987321432
Which Students are Included? High School Graduates of 2001/02 – 2007/08 First transitions to B.C. public post-secondary education: 2002/03 – 2008/09 Immediate Entry Immediate Entry Immediate Entry 1-Year Delay 5-Year Delay 1-Year Delay
ResearchQuestion #1 What proportion of B.C. Grade 12 Graduates enrol in B.C. public post-secondary education after graduation? When do they enrol?
Student Transitions – When? • 6-Year Delay • (1%) • 5-Year Delay • (2%) • 4-Year Delay • (2%) • 3-Year Delay • (3%) • 2-Year Delay • (5%) The majority enroll in Fall (44%) • 1-Year Delay • (11%) K-12 • Immediate Entry • (51%-52%) 7-Yr Cumulative Transition Rate = 75%
Research Question #2 Among those who do not transition to B.C. public post-secondary education, are they enrolling elsewhere? B.C. Private Institutions? Non-B.C. Institutions?
STP Links to Other Sources to Identify Student Enrollments Beyond the B.C. Public System The PEN makes the data linkage possible.
Student Transition Rates Over Six Years (2001/02 Grads): Two Perspectives (1) BC Public System Perspective: (2) All Sectors Perspective: Cum. 6-Year Transition Rate = 74% Cum. 6-Year Transition Rate = 81% Immed Entry (All Sectors) = 56%
ResearchQuestion #3 Does time of entry (Immediate vs. Delayed entry) have any influence on post-secondary sector destination?
% Distribution of Post-Secondary Registrants,by Sector Destination and Time of Entry High School Graduation Cohorts of 2001/02 to 2006/07
ResearchQuestion #4 Do academic qualifications from high school affect students’ post-secondary sector destinations?
% Distribution of Post-Secondary Registrants,by Sector Destination and Academic GPA at Gr12 Graduation High School Graduation Cohorts of 2001/02 to 2006/07. On average, 5% enrol outside of BC.
Sector Destination and Academic Qualifications:(BC Grade 12 Graduates of 2001/02 to 2006/07, by 2007/08)
ResearchQuestion #5 Do student sector destinations vary by student demographic characteristics?
Student Transitions into Post-Secondary Sectors, by Demographic Characteristics
ResearchQuestion #6 What are the regional differences in student sector destinations?
College Regions and Geographic Areas Vancouver Island: • 1 - Camosun • 8 - Malaspina • 11 - North Island • Lower Mainland: • 2 - Capilano • 15 - Vancouver/Langara • Boundary-Fraser Valley: • 4 - Douglas • 6 - Fraser Valley • 7 - Kwantlen • Interior: • 3 - Thompson Rivers • 5 - Rockies • 13 - Okanagan • 14 - Selkirk • Northern B.C.: • 9 - New Caledonia • 10 - Northern Lights • 12 - Northwest • http://www.bclmiguide.ca/application/maps/collegeregions.asp
Regional Transition Rates intoB.C. Public and B.C. Private Post-Sec Transition rates (by 2007/08) for high school graduation cohorts, 2001/02 to 2006/07.
College Regions and Geographic Areas Vancouver Island: • 1 - Camosun • 8 - Malaspina • 11 - North Island • Lower Mainland: • 2 - Capilano • 15 - Vancouver/Langara • Boundary-Fraser Valley: • 4 - Douglas • 6 - Fraser Valley • 7 - Kwantlen • Interior: • 3 - Thompson Rivers • 5 - Rockies • 13 - Okanagan • 14 - Selkirk • Northern B.C.: • 9 - New Caledonia • 10 - Northern Lights • 12 - Northwest Northern Lights Okanagan Rockies Selkirk Fraser Valley • http://www.bclmiguide.ca/application/maps/collegeregions.asp
Regional Variations in Student Transition Rates (Across All Sectors) 84% 72% 62% Transition rates (by 2007/08) for high school graduation cohorts, 2001/02 to 2006/07.
Research Question #7 Among those Grade 12 Graduates (5%) who enrolled outside of the B.C. Public Post-Secondary System, where did they enrol? Which Countries? Which Provinces?_
Country Destinations of Gr12 Grads Who Enrolled Outside of the B.C. Public Post-Secondary System Country destinations of high school graduates of 2001/02 to 2006/07 (by 2007/08) who enrolled outside of the B.C. Public Post-Secondary System (11,500 of 258,000 grads left B.C.)
Non-B.C. Post-Secondary Destinations,by Region of High School Graduation Note: Includes all B.C. grade 12 graduates of 2001/02 to 2006/07 who enrolled outside of B.C. by 2007/08 (N=11,527).
Research Question #8 What are the most popular B.C. Private post-secondary institution destinations? What about non-B.C. institutions?
Top 20 B.C. Private PSI Destinationsof Grade 12 Graduates of 2001/02 to 2006/07, by 2007/08 % of Rank B.C. Private Institution Count Total 1) Art Institute of Vancouver 932 12% 2) Trinity Western University 859 11% 3) Sprott-Shaw Community College 843 10% 4) Blanche Macdonald Centre 446 6% 5) Vancouver Career College 346 4% 6) Columbia Bible College 299 4% 7) CDI Coll Of Bus,Tech &Healthcare 276 3% 8) Vancouver Film School 240 3% 9) Centre For Arts And Technology 202 2% 10) John Casablancas Inst Of Applied Arts 179 2% 11) Stenberg College 163 2% 12) Marvel College 152 2% 13) Summit Pacific College 143 2% 14) Academy Of Learning 142 2% 15) Discovery Comm Coll 138 2% 16) Tourism Training Institute 131 2% 17) Canadian Tourism College 118 1% 18) MTI Community College 113 1% 19) West Coast College/Massage Therapy 104 1% 20) The International Culinary School AIV 87 1% Other B.C. Private Institutions 2,178 27% Grand Total 8,091 100%
Top 20 Non-B.C. Post-Secondary Destinationsof Grade 12 Graduates of 2001/02 to 2006/07, by 2007/08 % of Rank Non-B.C. Post-Secondary Institution City Prov Count Total 1) University of Toronto Toronto ON 1,050 9.1% 2) McGill University - Montreal Montreal PQ 997 8.6% 3) University of Calgary Calgary AB 789 6.8% 4) University of Alberta Edmonton AB 774 6.7% 5) Queen's University Kingston ON 674 5.8% 6) University of Waterloo Waterloo ON 483 4.2% 7) Southern Alberta Institute of Technology Calgary AB 294 2.6% 8) University of Western Ontario London ON 252 2.2% 9) Mount Royal University Calgary AB 244 2.1% 10) University of Lethbridge Lethbridge AB 196 1.7% 11) Carleton University Ottawa ON 193 1.7% 12) Lethbridge Community College Lethbridge AB 182 1.6% 13) University of Ottawa Ottawa ON 143 1.2% 14) York University Toronto ON 137 1.2% 15) Northern Alberta Institute of Technology Edmonton AB 136 1.2% 16) Grant MacEwan University Edmonton AB 130 1.1% 17) Briercrest College and Seminary Caronport SK 129 1.1% 18) Grande Prairie Regional College Grande Prairie AB 107 0.9% 19) Ryerson University Toronto ON 100 0.9% 20) Dalhousie University Halifax NS 98 0.9% Unknown ---- ---- 1,212 10.5% Other Non-B.C. Post-Secondary Institutions ---- ---- 3,207 27.8% Grand Total 11,527 100.0%
Research Question #9 What are the program destinations of students who enrol in B.C. public, B.C. private and non-B.C. institutions?
Program Destinations Program information is incomplete across all sectors. Some program patterns are evident, despite missing data.
ResearchQuestion #10 Among high school graduates who first enrolled in B.C. Private or Non-B.C. institutions, what proportion eventually enrolled in the B.C. public system over the next five years?
Cumulative % of 2001/02 Immediate-Entry Students who Attended Institutions Outside of the B.C. Public Post-Secondary System and Later Enrolled in the B.C. Public Post-secondary System Over the Next Five Years Sector of Immediate Entry: Roughly one-third who left eventually enrolled in the B.C. public system over next 5 yrs; more so from the B.C. privates.
Conclusion Summary of Key Findings
Key Findings – Student Transitions • More than half (51% to 52%) of B.C.’s grade 12 graduates enrol directly in B.C. public post-secondary education. • When transitions into all sectors are accounted for (B.C. public, private and non-B.C.), the student transition rate increases to 81% within six years of graduation. • Patterns by sector and program are evident: • B.C. Privates – more non-academic programs. • B.C. Public and Non-B.C. – more academic programs.
Key Findings – Most Stay in B.C. The B.C. public post-secondary system serves the vast majority of B.C.’s educational needs. On average, only 10% of grade 12 graduates who pursued post-secondary education within five years of graduation, enrolled in B.C. private or non-B.C. institutions. Among those who attended non-B.C. institutions, the majority (80%) stayed in Canada. Do they come back? Roughly one-third of those who enrolled in B.C. private or non-B.C. institutions eventually enrolled in the B.C. public system over the next 5 years.
Key Findings – Collaboration is Key B.C.’s Personal Education Number enables data linkages across education systems. Extensive co-operation and collaboration across education ministries and post-secondary institutions makes this STP research possible.
Secrets of Our Success • Start small • Small steering committee • Achievable research agenda • Collect minimum dataset to answer research questions • Manage the Data and Information • Collect data annually • Data sharing agreement • Data use policy • Data linkage policy • Expand incrementally • Add 1 year of data at a time • Minimize new data elements • Evolving research questions • Stability and continuity • Steering committee membership remains stable • Consultants replaced by permanent STP Manager • Sufficient/ongoing resources are allocated to the project.
Looking for More Information? • STP Web Site: • http://www.aved.gov.bc.ca/student_transitions/ • STP Fast Facts • Regional Transition Matrices • STP Highlights Newsletters • STP Research Reports