Download
1 / 16
160 likes | 248 Views
Dive into the realm of residential segregation, its historical context, measurement methods, and impacts on society. Explore various explanations and debates surrounding this critical social issue.

E N D
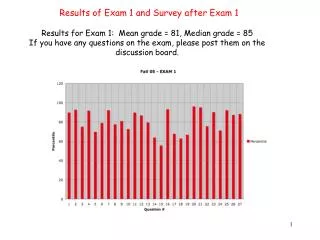
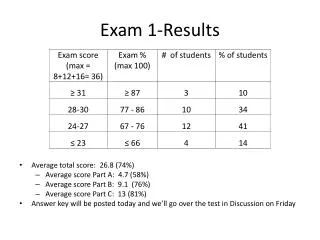
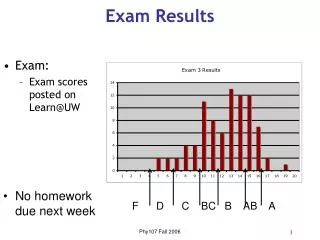
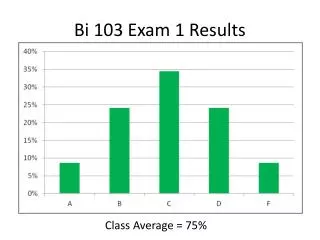
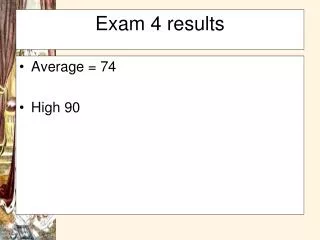
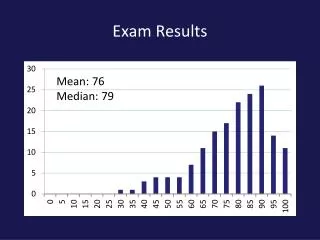
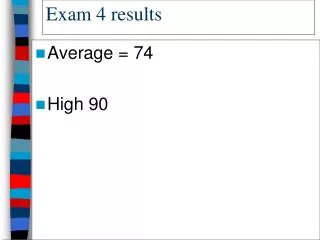
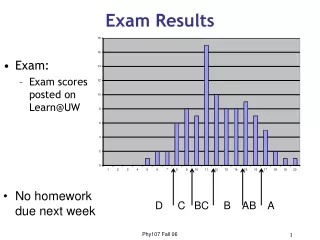
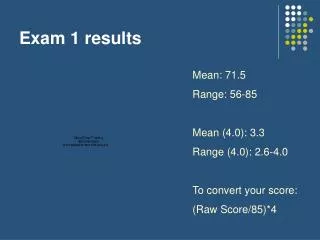
Exam 1 results Mean: 71.5 Range: 56-85 Mean (4.0): 3.3 Range (4.0): 2.6-4.0 To convert your score: (Raw Score/85)*4
Residential Segregation Residential segregation has proven to be the most resistant to change of all realms - perhaps because it is so critical to racial change in general. -Thomas Pettigrew
Why study residential segregation? • Sociology is concerned with residential segregation because • Residential/spatial distribution patterns are seen as mirroring social patterns/relationships • Residential (and distribution patterns in general) have consequences for life chances (contextual effects of community)
Conceptualizing Residential Patterns • “Segregation” - pattern of diffuse distributions across geographical units (blocks, census tracts, etc) • “Concentration” - form of segregation where all groups are not only dissimilar in distribution, but are also clustered together • “Centralization” - From of segregation and concentration in which one group is clustered near the center
Conceptualizing Residential Patterns • “Segregation” • “Concentration” • “Centralization”
Measuring Segregation • Index of Dissimilarity • The result is the percentage of one group that would have to move to get an equal distribution • 0 = perfectly distributed (no segregation) • 100 = no mixture of groups (fully segregated) • Contact measures • Chances of running into a similarly raced person • Isolation Index - the probability that you will meet someone in your group • Interaction Index - probability that you will meet someone from another group
History of U.S. segregation • Early 20th century (pre-civil rights legislation) • Less extreme black-white segregation at turn of century • In northern cities some blacks shared neighborhoods with poor immigrants • Black isolation was slight in 1890, increased over the next two decades and took off in 1910-1930 • WWI • Immigration declines while blacks began “Great Migration” • Ecological theory - new immigrant groups are more segregated • Competition for urban space leads to fire bombings, restrictive covenants, and mortgage discrimination
1980s and 1990s • Some decline but blacks still most segregated • Lower in West and South than in the North, Midwest or Northeast • The south has spatial integration but still social segregation • Challenges to segregation in the 1960-90 led to some decrease • Federal housing policy - “Fair Housing Act” • Liberalization of white’s attitudes • Gains in housing construction • Growth of Black middle class
Consequences of Segregation • Political Isolation • Linguistic isolation • Poverty Concentration (expensive goods) • Educational exclusion • Adaptation of “oppositional culture” • Segregation is worse for blacks and PR • Segregation + Poverty • Limits access to jobs - “Spatial Mismatch” • Greater Health Risks
Explanations for segregation • Human Ecology Model (everyone) - predicts segregation based on demographic and structural variables • Region, City size/age, new housing starts, suburbanization • Socioeconomic Status differences (Wilson) - higher incomes allow exodus from city centers • Race is not the cause, blacks with requisite financial resources move to suburbs • Evidence is mixed
Explanations (cont) • Preferences of Whites (Massey, Farley) - segregation persists because whites choose to live away from and exclude blacks from their neighborhoods • Black preferences have shifted away from integration, White toward but not by much • Discrimination by Individuals - official discrimination has given way to unofficial • Links preferences to outcomes • Whites may have fixed tolerance for living near minorities
Explanations (cont) • Discrimination by institutions (Massey, Farley) - real estate and lending practices • Audit studies demonstrate that blacks are denied more often and receive less favorable rates when granted a loan than similarly situated whites • “Redlining”, restrictive housing covenants • Same for rental market • Massey’s work in Philadelphia • Whites benefit from poverty concentration
Economic Inequality: Cause or Consequence? • Massey and Denton • Segregation causes inequality/poverty • Discriminatory housing practices cause and maintain segregation • Blacks with higher SES are more likely to share a tract with blacks of lower SES than whites • Wilson • SES is the problem • Deindustrialization, suburbanization, “Spatial Mismatch” • Black community is segregated according to SES
“White Flight” • Concerned with the extent to which racial and non-racial characteristics are associated with the “flight” of whites from central cities 1960-70s • Frey - No: flight can be accounted for by deteriorating economy and social environment (tax revenues, crime rates, job relocation) rather than race itself (% black, school desegregation) • Crowder - Yes: Racial makeup matters • Increases in Asian and Hispanic do not matter. Only for increases in black population