Download
1 / 24
260 likes | 482 Views
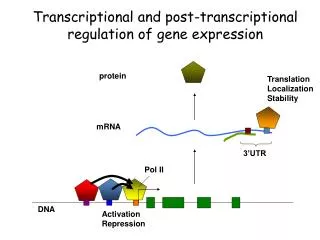
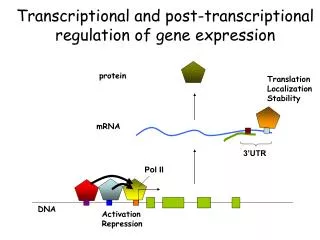
A Bioinformatics Pipeline to Explore Transcriptional Regulation in Plants. By Amy Marshall-Colon (University of Illinois Urbana-Champaign), Mary Williams (ASPB), and Kranthi Varala (Purdue University). Differential expression analysis: Tools and techniques, outcomes. Microarray. Gene Network.

E N D
A Bioinformatics Pipeline to Explore Transcriptional Regulation in Plants By Amy Marshall-Colon (University of Illinois Urbana-Champaign), Mary Williams (ASPB), and Kranthi Varala (Purdue University)
Differential expression analysis: Tools and techniques, outcomes Microarray Gene Network Data collection Quality control and preprocessing Differential expression analysis Expression and functional clustering Network analysis RNA analysis using microarray or RNA-Seq
Obtaining data for transcriptomic analysis: Microarrays and RNA-Sequencing • Isolate RNA from samples • Examples: • Leaf versus root • Wild-type versus mutant • Condition 1 vs Condition 2 Reverse transcribe to produce cDNA Quantify: Microarray or RNA-Seq Image: Erin Sparks (FigShare)
cDNA Microarrays: Quantification by hybridization In a microarray study, labeled cDNA (copied from mRNA) is hybridized to a chip with DNA probes. The amount of label is proportional to the amount of mRNA in the sample. A single sample can be used, or two samples can be combined with different labels to determine relative levels. L. Vallar, 2002.
RNA-sequencing: Quantification by sequencing Mutant Wild type Adapted from Griffith, M., Walker, J.R., Spies, N.C., Ainscough, B.J. and Griffith, O.L. (2015). Informatics for RNA Sequencing: A Web Resource for Analysis on the Cloud. PLOS Comp. Biol. 11: e1004393.
Differences between Microarray and RNA-Seq Explore expression changes in known transcripts and find novel ones Dynamic range: 9,560-fold Highly expressed genes may consume majority of reads Complex data analysis approximately > 5 GB • Explore changes in expression of known transcripts • Dynamic range: 44-fold • Saturation and loss of signal • Simple data analysis approximately < 1 GB Microarray RNA-Seq Note: Dynamic range is the ratio between the maximum and minimum expression level.
Steps in the analysis of transcriptomic data • Quality control • Data preprocessing and normalization • Differential gene analysis • Clustering (by expression and function) • Network analysis
Quality control for expression data Garbage in, garbage out If something has gone wrong with your RNA handling, you may find that one or more datasets are of poor quality. Bad data can skew your results. Quality control identifies bad data and eliminates or makes a correction to it. Here, two of the samples are globally very different from the rest, and need to be corrected or eliminated before analysis continues. Image source: NERC
Data preprocessing for microarrays: Objectives • Achieve a measurement scale so that • Samples have the same origin (zero or other) for all spots • Uses same units for all spots and microarrays • Has a linear relationship with the biological sample (DNA or RNA) • Deal with characteristics of each platform and experiment • Color differences • Reference sample • Summarize information for each gene • Platform characteristics (probesets)
The density histogram of any sample shows a typical curve and can be normalized Most genes are expressed at low level Normalization corrects for global differences between samples Some genes are expressed at very high level Density (number of probes with a given intensity) log intensity (to condense the data – the range is huge)
A sample RNA-Seq pipeline Data collection Preprocessing Differential expression analysis Mandadi, K.K. and Scholthof, K.-B.G. (2015). Genome-Wide Analysis of Alternative Splicing Landscapes Modulated during Plant-Virus Interactions in Brachypodium distachyon. Plant Cell. 27: 71-85.
Data Preprocessing steps for RNA-Seq Adapters cDNA • Remove adapter sequences and trim off low-confidence bases • Generate read counts for each gene • Align reads to genes and count no. of reads per gene (Read mapping) • OR • Count no. of times unique sequences from each gene are present in the reads (Quasi mapping) • Quality control in RNA-Seq, to identify low quality libraries is done via comparing global expression profiles AFTER pre-processing. EBI.ac.uk
Statistical methods for comparing two conditions • Null hypothesis, H0: There is no difference in expression between the conditions; • The “true” ratio between the expression of each gene in the two samples should be one. • The logarithm transformation converts these multiplicative effects (ratios) into additive effects (differences), which are easier to model. • The log ratio when there is no difference between conditions should thus be zero. Same or different? Absolute Expression Ratio Log 0 (=100) 1 Gene A 100 Gene B 100 2 (=102) 100 Gene A 1000 Gene B 10
Considerations for analysis of RNA-seq data • RNA-seq data has a high dynamic range and often suffers from over-dispersion. • Over-dispersion occurs when the observed variance in read count is greater than the assumed variance from the Poisson distribution. • A negative binomial (NB) distribution can better estimate gene counts when over-dispersion occurs. • NB is the basis of many RNA-seq analysis software like: EdgeR and DESeq.
Visualization of data: Volcano plots highlight differentially-expressed genes -log10(P) When p = 0.1, -log10 = 1 When p = 0.05, -log10 = 1.3 When p = 0.01, -log10 = 2 The larger the -log10 value, the smaller p. Generally, p values less than 0.05 are considered significant. Genes that are more than 2 fold differentially expressed (over- or under-) and with a p-value less than 0.05 are indicated in green and fuchsia, and are considered differentially expressed genes. 1 2 4 8 Expression ratio (log2) 0 indicates no difference in expression between condition 1 and 2 (20=1) 1 indicates 2-fold difference (21=2), and 2 indicates 4-fold difference (22=4) Jiao, Y., Ma, L., Strickland, E. and Deng, X.W. (2005). Conservation and divergence of light-regulated genome expression patterns during seedling development in rice and Arabidopsis. Plant Cell. 17: 3239-3256.
Cluster analysis is used to keep similar data together and dissimilar data apart • Genes may be clustered based on similarity of their expression pattern across samples. • Similarity of expression for two genes can be estimated by measuring the difference between the expressions levels of the two genes. • Two measures of similarity • Similar pattern of expression • Similar level of expression • Distance measures used to calculate similarity. Experiment 2 Experiment 1 Cluster Green in both experiments Red in both experiments Reprinted with permission from D'Haeseleer, P. (2005). How does gene expression clustering work? Nature Biotechnology. 23: 1499 - 1501
Example QTC clustering • Each cluster includes genes with similar expression patterns across samples. • E.g., Cluster 1 includes genes that are universally induced in the second half of the samples here.
Assigning biological function to DEGs through gene ontologies and network analysis A network plot showing transcription factors and genes involved in response to jasmonic acid Hickman, R., et al. (2017). Architecture and dynamics of the jasmonic acid gene regulatory network. Plant Cell. 29: 2086-2105.
Gene ontologies: The what, when, and where of gene function Gene ontologies use a consistent vocabulary across organisms to identify gene function. There are thousands of GO terms. Some examples: Biological function: Metabolic process -> Primary metabolic process -> Carbohydrate metabolic process Molecular function: Enzyme -> Adenylate cyclase Cellular Component: Membrane -> Golgi apparatus WARNING: Many of the GO terms are inferred, not experimentally verified Lanver, D., et al. (2018). The biotrophic development of Ustilago maydis studied by RNA-Seq analysis. Plant Cell. 30: 300-323.
Gene networks visualize relationships among genes and other cellular entities • Network nodes represent cellular entities such as genes. • Network edges represent connection between nodes. • Transcription factor regulation of its target gene(s), or • Protein-protein interactions or • Correlation of gene expression etc. • Network analysis methods aim to compute a quantitative measure of the influence of each individual gene in the larger network.
A gene coexpression network can identify genes involved in similar pathways Enzymes in the pathway cluster in coexpression network analysis Benzoxazinoid biosynthetic pathway in maize Wisecaver, J.H., Borowsky, A.T., Tzin, V., Jander, G., Kliebenstein, D.J. and Rokas, A. (2017). A global coexpression network approach for connecting genes to specialized metabolic pathways in plants. Plant Cell. 29: 944-959.
A gene regulatory network can be assembled from several different types of data • Transcriptomic data can reveal coexpression modules, but additional data are needed to assemble gene regulatory networks • GO data identify transcription factors • ChIP-Seq and other data reveal cis-elements and transcription factor binding sites on genes • Experimental knockout and overexpression studies can demonstrate functional interactions Example: Cis element enrichment in coexpression modules Wilkins, O., et al. . and Purugganan, M. (2016). EGRINs (Environmental Gene Regulatory Influence Networks) in rice that function in the response to water deficit, high temperature, and agricultural environments. Plant Cell. 28: 2365-2384; Mine, A., et al. and Tsuda, K. (2018). The defense phytohormone signaling network enables rapid, high-amplitude transcriptional reprogramming during effector-triggered immunity. Plant Cell. 30: 1199-1219.
A gene regulatory network identifies directional interactions such as transcriptional regulation Example: Regulatory network in oxidative stress response. Triangles indicate transcription factors and circles clusters of co-regulated genes. Vermeirssen, V., De Clercq, I., Van Parys, T., Van Breusegem, F. and Van de Peer, Y. (2014). Arabidopsis ensemble reverse-engineered gene regulatory network discloses interconnected transcription factors in oxidative stress. Plant Cell. 26: 4656-4679.
Scientists deposit their data into public repositories, so others can learn from it ePlant (http://bar.utoronto.ca/eplant/) connects databases so you can explore all that is known about your favorite gene, including where it sits in gene networks. Waese, J., Fan, J., Pasha, A., Yu, H., Fucile, G., Shi, R., Cumming, M., Kelley, L.A., Sternberg, M.J., Krishnakumar, V., Ferlanti, E., Miller, J., Town, C., Stuerzlinger, W. and Provart, N.J. (2017). ePlant: Visualizing and exploring multiple levels of data for hypothesis generation in plant biology. Plant Cell. 29: 1806-1821.