Download
1 / 34
360 likes | 681 Views
Explore gas power cycles in heat engines, focusing on efficiency and the Carnot Cycle. Study the Otto Cycle and ideal engine processes. Learn key terminologies for reciprocating devices.

E N D
UNIT 2Gas Power Cyclesby Deepa M S & Varuna TandonSource: Thermodynamics: An Engineering Approach, 5th editionby Yunus A. Çengel and Michael A. Boles
Our study of gas power cycles will involve the study of those heat engines in which the working fluid remains in the gaseous state throughout the cycle. We often study the ideal cycle in which internal irreversibilities and complexities (the actual intake of air and fuel, the actual combustion process, and the exhaust of products of combustion among others) are removed. We will be concerned with how the major parameters of the cycle affect the performance of heat engines. The performance is often measured in terms of the cycle efficiency.
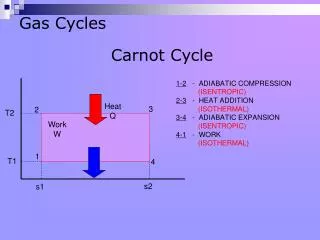
Carnot Cycle The Carnot cycle was introduced in Chapter 5 as the most efficient heat engine that can operate between two fixed temperatures TH and TL. The Carnot cycle is described by the following four processes. Carnot Cycle Process Description 1-2 Isothermal heat addition 2-3 Isentropic expansion 3-4 Isothermal heat rejection 4-1 Isentropic compression
Note the processes on both the P-v and T-s diagrams. The areas under the process curves on the P-v diagram represent the work done for closed systems. The net cycle work done is the area enclosed by the cycle on the P-v diagram. The areas under the process curves on the T-s diagram represent the heat transfer for the processes. The net heat added to the cycle is the area that is enclosed by the cycle on the T-s diagram. For a cycle we know Wnet = Qnet; therefore, the areas enclosed on the P-v and T-s diagrams are equal. We often use the Carnot efficiency as a means to think about ways to improve the cycle efficiency of other cycles. One of the observations about the efficiency of both ideal and actual cycles comes from the Carnot efficiency: Thermal efficiency increases with an increase in the average temperature at which heat is supplied to the system or with a decrease in the average temperature at which heat is rejected from the system.
Air-Standard Assumptions In our study of gas power cycles, we assume that the working fluid is air, and the air undergoes a thermodynamic cycle even though the working fluid in the actual power system does not undergo a cycle. To simplify the analysis, we approximate the cycles with the following assumptions: • The air continuously circulates in a closed loop and always behaves as an ideal gas. • All the processes that make up the cycle are internally reversible. • The combustion process is replaced by a heat-addition process from an external source. • A heat rejection process that restores the working fluid to its initial state replaces the exhaust process. • The cold-air-standard assumptions apply when the working fluid is air and has constant specific heat evaluated at room temperature (25oC or 77oF).
Terminology for Reciprocating Devices The following is some terminology we need to understand for reciprocating engines—typically piston-cylinder devices. Let’s look at the following figures for the definitions of top dead center (TDC), bottom dead center (BDC), stroke, bore, intake valve, exhaust valve, clearance volume, displacement volume, compression ratio, and mean effective pressure.
The compression ratio r of an engine is the ratio of the maximum volume to the minimum volume formed in the cylinder. The mean effective pressure(MEP) is a fictitious pressure that, if it operated on the piston during the entire power stroke, would produce the same amount of net work as that produced during the actual cycle.
Otto Cycle: The Ideal Cycle for Spark-Ignition Engines Consider the automotive spark-ignition power cycle. Processes Intake stroke Compression stroke Power (expansion) stroke Exhaust stroke Often the ignition and combustion process begins before the completion of the compression stroke. The number of crank angle degrees before the piston reaches TDC on the number one piston at which the spark occurs is called the engine timing. What are the compression ratio and timing of your engine in your car, truck, or motorcycle?
The air-standard Otto cycle is the ideal cycle that approximates the spark-ignition combustion engine. Process Description 1-2 Isentropic compression 2-3 Constant volume heat addition 3-4 Isentropic expansion 4-1 Constant volume heat rejection The P-v and T-s diagrams are
Thermal Efficiency of the Otto cycle: Now to find Qin and Qout. Apply first law closed system to process 2-3, V = constant. Thus, for constant specific heats,
Apply first law closed system to process 4-1, V = constant. Thus, for constant specific heats, The thermal efficiency becomes
Recall processes 1-2 and 3-4 are isentropic, so Since V3 = V2 and V4 = V1, we see that
The Otto cycle efficiency becomes Is this the same as the Carnot cycle efficiency? Since process 1-2 is isentropic, where the compression ratio is r = V1/V2 and
We see that increasing the compression ratio increases the thermal efficiency. However, there is a limit on r depending upon the fuel. Fuels under high temperature resulting from high compression ratios will prematurely ignite, causing knock.
Example 9-1 An Otto cycle having a compression ratio of 9:1 uses air as the working fluid. Initially P1 = 95 kPa, T1 = 17oC, and V1 = 3.8 liters. During the heat addition process, 7.5 kJ of heat are added. Determine all T's, P's, th, the back work ratio, and the mean effective pressure. Process Diagrams: Review the P-v and T-s diagrams given above for the Otto cycle. Assume constant specific heats with Cv = 0.718 kJ/kg K, k = 1.4. (Use the 300 K data from Table A-2) Process 1-2 is isentropic; therefore, recalling that r = V1/V2 = 9,
The first law closed system for process 2-3 was shown to reduce to (your homework solutions must be complete; that is, develop your equations from the application of the first law for each process as we did in obtaining the Otto cycle efficiency equation) Let qin = Qin / m and m = V1/v1
Using the combined gas law (V3 = V2) Process 3-4 is isentropic; therefore,
Process 4-1 is constant volume. So the first law for the closed system gives, on a mass basis, The first law applied to the cycle gives (Recall ucycle = 0)
The thermal efficiency is The mean effective pressure is
The back work ratio is (can you show that this is true?) Air-Standard Diesel Cycle The air-standard Diesel cycle is the ideal cycle that approximates the Diesel combustion engine Process Description 1-2 Isentropic compression 2-3 Constant pressure heat addition 3-4 Isentropic expansion 4-1 Constant volume heat rejection The P-v and T-s diagrams are
Thermal efficiency of the Diesel cycle Now to find Qin and Qout. Apply the first law closed system to process 2-3, P = constant. Thus, for constant specific heats
Apply the first law closed system to process 4-1, V = constant (just as we did for the Otto cycle) Thus, for constant specific heats The thermal efficiency becomes
What is T3/T2 ? where rc is called the cutoff ratio, defined as V3 /V2, and is a measure of the duration of the heat addition at constant pressure. Since the fuel is injected directly into the cylinder, the cutoff ratio can be related to the number of degrees that the crank rotated during the fuel injection into the cylinder.
What is T4/T1 ? Recall processes 1-2 and 3-4 are isentropic, so Since V4 = V1 and P3 = P2, we divide the second equation by the first equation and obtain Therefore,
* What happens as rc goes to 1? Sketch the P-v diagram for the Diesel cycle and show rc approaching 1 in the limit.
When rc > 1 for a fixed r, . But, since , .
Qin Qin Qout Air Dual Cycle TC BC Const volume heat addition Process Compression Process Const pressure heat addition Process Expansion Process Const volume heat rejection Process Thermodynamic Dual Cycle
Dual Cycle Process 1 2 Isentropic compression Process 2 2.5 Constant volume heat addition Process 2.5 3 Constant pressure heat addition Process 3 4 Isentropic expansion Process 4 1 Constant volume heat rejection Qin 3 2.5 3 Qin 2 2.5 4 2 4 1 Qout 1
Thermal Efficiency Note, the Otto cycle (rc=1) and the Diesel cycle (a=1) are special cases:
The use of the Dual cycle requires information about either: • the fractions of constant volume and constant pressure heat addition • (common assumption is to equally split the heat addition), or • ii) maximum pressure P3. • Transformation of rc and a into more natural variables yields For the same inlet conditions P1, V1 and the same compression ratio: For the same inlet conditions P1, V1 and the same peak pressure P3 (actual design limitation in engines):
For the same inlet conditions P1, V1 and the same compression ratio P2/P1: For the same inlet conditions P1, V1 and the same peak pressure P3: Pmax “x” →“2.5” Pressure, P Pressure, P Po Po Specific Volume Specific Volume Tmax Otto Dual Diesel Diesel Dual Temperature, T Temperature, T Otto Entropy Entropy