Download
1 / 10
100 likes | 142 Views
Explore the theoretical effects of business method patents on innovation in different industries and the economic implications of increased patent protections. Learn about patent quality concerns and potential solutions to enhance the patent system.

E N D
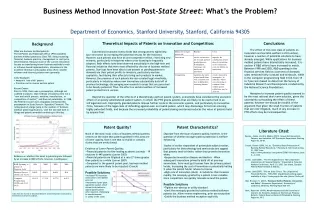
Catherine Business Method Innovation Post-State Street: What’s the Problem? Department of Economics, Stanford University, Stanford, California 94305 Theoretical Impacts of Patents on Innovation and Competition: Conclusions Background The effect of this new class of patents on innovation and societal welfare is still unclear, however a number of potential solutions to have already emerged. While applications for business method patents have dramatically increased, it is unclear if R&D efforts have increased to match. Between 1998 and 2003, R&D spending in the financial services field as a percent of domestic sales remained fairly constant and miniscule, while in the computer programming field it fell from 15 to 7 percent (based on data from the Survey of Industrial Research and Development conducted by the National Science Foundation). Measures to increase patent quality seemed to be the most rational short-term solution, given the uncertainty surrounding the effect of these patents; however we should be mindful of the argument that given the small fraction of patents that are ever litigated, much of any increase in PTO efforts may be inconsequential. • What are business method patents: • The US Patent and Trademark Office (PTO) classifies business method patents as Class 705: data processing: financial, business practice, management or cost/price determination. Because much of the current innovation focuses on transferring known business methods to web- or software-based implementation, discussions in the academic literature and popular press often consider software and internet patents more generally. • Some Examples: • Amazon’s ‘one-click’ patent • Priceline.com’s reverse auction patent • Recent Events: • Prior to 1998, there was a presumption, although not codified in statute, that methods of business were not a “new and useful process, machine, manufacture, or composition of matter,” and thus not patentable. In 1998, the Federal Circuit Court of Appeals overturned this presumption in State Street v. Signature Financial. The ruling spurred a large jump in the number of ‘business method’ patent applications, with the increase both in filings and patents awarded continuing to this day. Conventional economic theory holds that strong patents rights help spur innovation by increasing the potential returns for the innovator. However, such patents also have an anti-competitive effect, restricting new entrants, particularly in industries where cross-licensing is frequently adopted. Both effects have been observed anecdotally in the high-tech and financial industries that were most affected by the rise of business method patents. Start-ups have been able to use patents or pending patents to demonstrate their potent profits to investors, particularly venture capitalists, facilitating their effects to bring such products to market. However, the presence of such patents has also created legal minefields, particularly in industries where new innovations substantially build off of previous technology, discouraging new research in areas that are perceived to be heavily patented. Thus, the effect on societal welfare of increased patent protections is unclear. Beyond the question of the effects of a theoretically perfect patent system, economists have considered the economic effect of an poorly administered patent system, in which the PTO grants patents that are likely to be overturned in an infringement suit. Improperly granted patents impose further costs to the economic system, and particularly to innovative firms, because of the legal costs of defending against even an invalid patent, which may discourage firms from entering highly patented fields, and because the increased probability of patents being overturned reduces the value of patents held by anyone firm. Patent Quality? Patent Characteristics? Literature Cited: • Much of the most vocal critics of business method patents centers on the claim that patents granted in this area are of lower quality, that is one that is invalid or contains claims that are overly broad. • Evidence of Lower Patent Quality: • Financial patents cite few leading academic journals – 19 citations in 445 patents (Lerner 2003) • Financial patents are litigated at a rate 27 times greater than patents as a while (Lerner 2007) • Compared to the general patent pool, business method patents are more likely to be rejected (Crouch) • Possible Solutions • Increase PTO resources • and access to non-patent • prior art • Implement a post-grantopposition system which allows third-parties to appeal patent grants after issuance, challengingto nonobviousness or utility of the claim. • Separate from the issue of patent quality, however, is the question of whether stronger patent protection is welfare-enhancing • Studies of earlier expansions of patentable subject matter, particularly for biotechnology and semiconductors suggest that patents tend to hinder, rather than promote innovation when: • Sequential innovation (Bessen and Maskin) – When subsequent innovations primarily build off of previous innovations, firms must get licenses from the primary patent holder, increasing the cost of innovation or potentially halting it when the patent holder refuses to license • High rate of innovation (Hunt) –In industries that innovate rapidly, the monopoly granted by a patent is less valuable, since competitors can quickly innovate around the patent. • Possible Solutions • Tighten non-obvious or utility standard • Limit the monopoly granted by business method/software patents (ex. Allow reverse engineering, prior use exception) • Codify the business method exception explicitly Bessen, James, and Eric Maskin (1999). Sequential Innovation, Patents, and Imitation. MIT Economics Department Working Paper No. 00-01. Crouch, Dennis (2006, Oct 6). “Evidence Based Prosecution V: Business Method Rejections.” Patently-O. Retrieved on May 21, 2007 from http://www.patentlyo.com/patent/2006/10/evidence_base d__2.html. Lerner, Josh (2003). “The Two Edged Sword: The Competitive Implications of Financial Patents.” Presented at Financial Markets Conference, April 2-5, 2003. Sea Island, Georgia: Federal Reserve Bank of Atlanta. Lerner, Josh (2007). Tolls on State Street: The Litigation of Financial Patents, 1976-2005. Unpublished working paper, available at http://www.people.hbs.edu/jlerner/Trolls.pdf Hall, Bronwyn H. (2003). "BusinessMethodPatents, Innovation, and Policy". Economics Department, University of California, Berkeley, Working Paper E03-331. Hunt, Robert M. (1999). Nonobviousness and the Incentive to Innovte: An Economic Analysis of Intellectual Protpery Reform. Federal Reserve Banks of Philadelphia Working Paper No. 99-3. Source: Hall Evidence on whether this boost in patenting was followed by an increase in R&D efforts, however, is ambiguous: Data from the Survey of Industrial Research and Development conducted by the National Science Foundation.
Megha Mandating Human Papillomavirus Vaccination: Comparison and Reliability of Vaccine Models Department of Economics, Stanford University, Stanford, California 94305 • Goals • Evaluate mathematical models that project the long-term epidemiologic and economic consequences of HPV vaccination strategies within the U.S. • Specifically: • Compare the impact and cost-effectiveness results of the four specific models in the context of vaccinating 12 year old females • Evaluate the accuracy and reliability of general cohort and population dynamic modeling of vaccines • Models • In March, 2007, the Advisory Committee on Immunization Practices (ACIP) recommended Gardasil for vaccination in females aged 11-12 years. It cited 4 studies on the potential cost effectiveness of vaccine in the context of cervical cancer screening practices in U.S. • Cohort (Markov health-state transition) Models: 1. “Cost-effectiveness of a potential vaccine for human papillomavirus.” GD Sanders & AV Taira 2. “Projected clinical benefits and cost-effectiveness of a human papillomavirus 16/18 vaccine.” SJ Goldie, M Kohli, et al. • Population Dynamic Models: 3. “Evaluating human papillomavirus vaccination programs.” AV Taira, et al.* 4. “Model for assessing human papillomavirus vaccination.” E Elbasha, et al. Abstract In June, 2006, Merck introduced the world’s first vaccine to prevent cervical cancer, Gardasil. Since the vaccine is 100% efficacious against human papillomavirus (HPV) strains resulting in 70% of all cervical cancer cases, debates over mandating vaccination in the U.S. have arisen. This study evaluates the four mathematical models that led to the Advisory Committee on Immunization Practices’ (ACIP) recommendation of vaccinating females aged 11-12 years. The models utilize cohort and population dynamic methods to project the impact and cost-effectiveness of vaccination strategies under different base-case assumptions. The models predict cost-effective reductions in cervical cancer risk from 20% to 78%. However, only one model closely models the characteristics of Gardasil and incorporates herd immunity, which significantly increases vaccine impact and decreases incremental cost-effectiveness ratios (ICER). Both types of models also rely on many unknowns regarding Gardasil and its target population, such as duration of efficacy and coverage. Differences in these values cause a 16.4% to 117.3% increase in ICER’s and a 17.8% to 69.2% decrease in impact on disease incidence. Thus, researchers should gather more data on HPV and Gardasil, through natural diffusion and learning by using, before mandating vaccination. Comparison of Models Figure 1. Cohort models incorporate death & HPV disease progression. Table 2. Base-case assumptions of models Cost-Effectiveness Impact on Disease Incidence Figure 2. Dynamic models incorporate changes in population and HPV infection rates. • Background • Human Papillomavirus (HPV) Infecting 6.2 million Americans each year, HPV results in genital warts, cervical cancer, and other types of cancer. These diseases cost the U.S. over $4 billion annually in direct costs. • Table 1. Percent of cancers due to HPV infection in the U.S. in 2003. • Cervical Cancer In 2007, cervical cancer will kill 3,670 U.S. women. In developing countries, it is the 2nd most common cancer among women, resulting in 300,000 annual deaths. • Gardasil • At $360 for a series of three doses, plus administering costs, the new vaccine is 100% effective against HPV strains 6 and 11, which cause genital warts, and strains 16 and 18, which are responsible for 70% of all cervical cancer cases. • Debates Over Mandatory Vaccination for 12 Year Old Females Moral issues: encouraging increased sexual behavior Economic issues: cost-effectiveness given current cervical cancer screening procedures in the U.S. Figure 4. Reductions in lifetime cervical cancer risk for vaccinated cohorts (12 year old females) under current U.S. screening practices and base-case assumptions, by model. Figure 5. ICER’s of vaccinating 12 year old girls in each model, compared to screening only, under base-case assumptions and with current U.S. screening practices. In the U.S., the upper limit of cost-effectiveness is $50,000-$100,000/QALY. Figure 3. Incremental cost-effectiveness ratio (ICER) of changing from strategy B to strategy A. • All models find vaccination of 12 year old females efficacious and cost-effective • Model impact increases and the ICER decreases as more herd immunity effects are incorporated • The model with the greatest reduction in cervical cancer incidence also has the lowest ICER (model 4) • In terms of cost, efficacy, and target HPV strains, model 4 most replicates the attributes of Gardasil • Model 4, the only model fully incorporating herd immunity, finds a 134% greater impact and a 79.8% lower ICER than Model 2, which has similar base-case assumptions but does not include herd immunity *Hybrid model: follows one cohort but captures herd immunity effects Conclusions Reliability of Models • Although all of the models find an HPV vaccine to be cost-effective and efficacious for 12 year old females in the U.S., a comparison of the models shows that model 4 is significantly the most accurate due to its base-case assumptions and inclusion of herd immunity. • Unknowns about Gardasil, HPV disease dynamics, and population characteristics significantly affect model results, decreasing vaccine impact on disease incidence and increasing ICER’s. • Increasing vaccine coverage increases ICER. • Allow unregulated diffusion of vaccine until scientists obtain further information on unknowns and assumptions from learning by using. • Mandatory vaccination is likely to be more cost-effective and efficacious in developing countries with poorer screening procedures. Cohort Model Dynamic Model ICER Disease Incidence Table 4. Percent increase in ICER’s of 12-year-old female vaccination due to changes in base-case assumptions. *Includes catch-up vaccination for females 12-24 years old. **CIN2/3, CIS = 0.87; CIN1, GW = 0.91. Table 3. Percent increase in ICER’s of 12-year-old female vaccination due to changes in base-case assumptions. For More Information Please contact Megha Agrawal (meg85@stanford.edu) for more information. Figure 6. Reduction in disease incidence with 10 year vaccine efficacy as a percentage of reduction in incidence with lifelong efficacy. Figure 6. Reduction in disease incidence with 10 year vaccine efficacy as a percentage of reduction in incidence with lifelong efficacy.
Carbon Capture and Storage: The Effects of Risk Type on the Diffusion of an Innovation Department of Economics, Stanford University, Stanford, California 94305 How does diffusion vary with risk? Types of Risk Background & Motivation Conclusions Risk can be defined along the following two questions: Who is the risk to? The individual adopter? The immediate vicinity? The entire world? How great is the risk? Is it a “statistical” indirect risk or is it an immediate direct risk? Carbon capture and sequestration falls right around the center of this matrix. It is an indirect risk to the local environment. In individually-risky innovations we have agencies such as the FDA regulate private businesses. In globally-risky innovations we typically end up with a highly regulated business environment that is almost a Public-Private Partnership, as with nuclear power. CCS is similar to natural gas storage in the US today. The benefits of CO2 capture and sequestration are global, but the risk and the assumed costs are local. Therefore policy should be crafted such that the locales have a chance to be rewarded for assuming the risk. Without any reward, they will never agree to take on the risk. Risky innovations are not vetoed. In improving our world, we must maximize value, not just minimize risk. If a technology such as CCS allows us to gather great benefit from the reduced risk of global climate change at the expense of relatively slight local risk, that may be a price we should be willing to pay. The challenge is in providing enough benefits for the local community such that they become actively interested in allowing carbon storage beneath their land. It can be done in a manner similar to the way we regulate mineral rights today. In response to the concern that global greenhouse gas emissions lead to climate change, power companies are looking into viable and scalable carbon free power. Carbon capture and sequestration (CCS) is one such technology that allows the use of coal in baseload electricity to become carbon neutral and compete in a carbon-restricted environment. The advantages of CCS vis-à-vis other renewable sources of power is scalability. The BP Peterhead Project, a 475 MW power plant in northern Scotland, that employs CCS technology, will produce as much clean electricity as the entire UK wind industry, or one half of the entire worldwide shipments of solar last year. However, some perceive CCS as a risky proposition because the carbon dioxide injected into geological formations can leak. The famous incident at Lake Nyos, Cameroon, where large amounts of naturally occurring CO2 were released and asphyxiated 1,700 residents and thousands of cattle. More realistically, given the concentrations in CCS projects, the risk is in seepage to local lakes and aquifers and the resultant acidification. Risk in many instances defines the limits to the diffusion of an innovation. But what different types of risk are there, and how does diffusion vary among them? Wide adoption Diffusion Global risk Early adopters Time Community-direct effect Community-indirect effect Indirect risk Direct risk • Four categories of risk in innovations: • Individual-indirect: automobiles • Individual-direct: pharmaceuticals • Community-indirect: pesticides • Community-direct: nuclear power plants • All innovations carry a benefit as well as a cost. In economics, actions are defined as having an expected utility – the expected benefits minus the expected costs. Individual adopter risk Literature Cited Herzog, Howard J. “Clean Coal Technology for a Greenhouse Gas Constrained World.” Presentation given at Council of State Governments Eastern Regional Conference, MIT, May 11, 2006. Gardiner Hill. “Pre Combustion capture from gas: The Peterhead Hydrogen Power Project.” Presentation given at CSLF Workshop, Paris, France, March 2007. Announced Carbon Capture and Sequestration Projects, in MW 2007-2017 Cumulative Worldwide Solar Power Production in MW 1993-2006, at a 30% Capacity Factor Acknowledgments I would like to thank Dr. Jerry Harris for advising me on my Honors Thesis on CCS and to Dr. Ward Hanson for allowing me to present some of the conclusions at the SIEPR Policy Forum. For further information Please contact if you have any questions. BP Peterhead Project in Scotland
350 300 200 250 150 100 50 0 Wholesale Diesel Retail Diesel Soybean Biodiesel Cents per Gallon 1/02 3/02 5/02 7/02 9/02 11/02 1/03 3/03 5/03 7/03 9/03 11/0 1/04 3/04 5/04 The Feasibility of Soybean Biodiesel Department of Economics, Stanford University, Stanford, California 94305 Abstract Environmental Effects Conclusions Costs: Benefits: • • Soybean production spreads agrichemicals, such as pesticides, N and P • • Agrichemicals can reduce biodiversity and elevate nitrate and nitrite levels in the water supply • • Land clearing for soybean farming releases significant amounts of CO2 • •Land clearing for large-scale biofuel production threatens habitats • • Soybean biodiesel produces more nitrogen oxides than petrodiesel • The soybean biodiesel industry is experiencing tremendous growth, from less than 10 biodiesel plants in 2000 to 105 plants currently operating and 77 more under construction. Biodiesel production capacity is projected to reach 1.7 billion gallons by 2008. US policy will determine the direction and future growth of this industry through tax incentives, subsidies and regulation. • • Without favorable public policy, soybean biodiesel is not cost competitive with petrodiesel on a price per gallon basis • • Soybean biodiesel is a cost effective way to reduce emissions in niche markets and as a fuel additive • • Currently US regulation, subsidies, and tax incentives are making biodiesel more competitive with petrofuels • • However, biodiesel will not be able to supply the entire US market • • US should ultimately seek renewable energy sources that do not compete with the food supply • • Nonfood feedstocks that can grow on marginal land with few inputs are a better long term solution • • The future of biofuels are Synfuel hydrocarbons or cellulosic ethanol that can provide long term sustainable energy with greater environmental benefits than soybean biodiesel Soybean biodiesel, a fuel comprised of part soybean oil and part diesel gasoline, is gaining popularity as an alternative fuel in the United States. Although biofuels benefit the environment and the US agricultural industry, they may lack economic competitiveness and an appropriate potential supply. The soybean biodiesel industry currently relies on government subsides and tax incentives to provide competitive prices relative petrofuels. Whether or not these current subsidies are worthwhile depends upon the long-term viability of the soybean biodiesel market and relative benefits compared to the existing petrofuel system. My research examines the net energy gain, environmental benefits, economic competitiveness, and potential supply in order to determine the impact of soybean biodiesel on the economy and the environment. • Biodiesel greatly reduces emissions of CO and CO2 • Contains less harmful hydrocarbons than petrofuels • Can reduce up to 20% of tailpipe particulate emissions • Overall emissions is 59% of the greenhouse gas emissions from an equivalent amount of diesel fuel • High cetane ratings improves car performance and reduces emissions • It is biodegradable and non-toxic Main Points Figure 2: Soybean biodiesel emissions compared to Petrodiesel Background Economic Competitiveness Potential Supply Industry Structure: • In 2006, 53 biodiesel plants had the production capacity of 354 million tons • The biodiesel industry has the processing capacity to increase production rapidly as demand increases (See Figure 4) • Industry has moved from small batch plants to larger-scale continuous producers Demand for Biodiesel: • The amount of biodiesel demanded has been historically low outside of niche markets due its high prices compared to petrodiesel (See Figure 3) • However, recent subsidies, tax incentives, and environmental regulation in addition to rising petrofuel prices have raised demand • There is also consistent demand for soybean biodiesel as a fuel additive Biodiesel Infrastructure: • Can be used with many current vehicles - “Change your fuel, not your car” • There are about 600 biodiesel gas stations in the US compared to over 165,000 petrofuel gas stations • Most of soybean biodiesel sold today is delivered directly to the consumer by small, fragmented producers Uncertainties: • Biodiesel’s affect on food supplies • The affect fluctuating soybean prices will have on biodiesel’s profitability As the greatest global producer of greenhouse gas emissions,, the US faces the challenge of reducing its consumption of petrofuels. Beyond global warming, the finite supply and price volatility of petrofuels provide another rationale for adopting new energy sources. One strategy to reduce petrofuel use is to substitute petrofuels with sustainable, environmentally beneficial biofuels, such as soybean biodiesel. • Soybean biodiesel is part soy oil, part diesel fuel and has environmental and engine lubricity advantages over pure petrodiesel • It can be used in most diesel engines without modifications • It is currently popular within the agricultural and transit industries • The cost of biodiesel can be lowered through process improvements and economies of scale but targeted policy is necessary to make biodiesel cost competitive with petrodiesel Current Situation: • Soy oil is a low-priced byproduct of soy meal available in relatively large volumes • However, US diesel consumption is 23 billion gallons and rising • The US will produce 250 million gallons of biodiesel in 2007 (only 0.4% of US diesel consumption) Genetic/Agronomic Improvement: • Feedstock supply could increase through additional acreage, improved soybean varieties, and the use of idle crop land • However, soybeans need to be produced on valuable farm land, which limits the amount of idle crop land that can be devoted to its use • Genetic modifications can increase disease resistance and oil content while reducing the need for soil tillage Production Limitations: • Total soybean feedstock supply in the United States is limited to 10% of current diesel consumption • A portion of soybean production must be diverted toward domestic food production • The increasing demand for biodiesel will tend to increase feedstock price and the production costs for biodiesel manufacturers • The soybean biodiesel industry’s biggest challenge may be the ability of the feedstock supply to keep up with growing demand Net Energy Balance Biodiesel plant located in Ralston, Iowa Figure 4: US biodiesel production and installed capacity, 2000-2006 Figure 3: Relative prices of Soybean Biodiesel, Wholesale diesel, and Retail Diesel For More Information: Figure 1: Net Energy Balance of soybean biodiesel vs. other Fuels Net Energy Balance (NEB): Energy output of biodiesel - Energy inputs Please contact Amanda Guy at amguy@stanford.edu for any further questions that you may have • The most accurate NEB values come from life cycle studies that measure all costs of soybean production from the extraction of all raw materials to the final end-use of the fuel • Soybean biodiesel has a positive NEB since it does not require more energy to make than it yields • Soybean biodiesel produces 3.2 units of fuel energy for every energy unit of fossil fuel consumed in its production • Petrodiesel produces only 0.84 units of fuel energy per units of fossil fuel energy consumed On the Internet: National Biodiesel Board: http://www.biodiesel.org/ United Soybean Board: http://unitedsoybean.org/ CRS report for Congress: http://www.nationalaglawcenter.org/assets/crs/RL32712.pdf • "The use of vegetable oils for engine fuels may seem insignificant today. But such oils may become in course of time as important as petroleum and the coal tar products of the present time." • - Rudolf Diesel, 1912 • Designed the diesel engine to run on peanut oil .
Regulating Hedge Funds: An Unnecessary Attempt Department of Economics, Stanford University, Stanford, California 94305 • Hedge funds generally bet against unsustainable irregularities in the market, reducing market risks. For example, following Amaranth’s collapse, others including hedge funds quickly bought up Amaranth’s discounted positions, preventing further disaster. • Hedge funds absorb more risk than create it. The funds can be viewed as insurers; shouldering risks that others wish to avoid, they remove a potential obstacle to business. • Hedge funds provide much provided liquidity in the securities, derivatives, and commodities markets, creating a much more efficient global markets. • Including hedge funds in diversified portfolios of U.S. stocks, Treasury Bonds, or stocks and bonds, improves the risk/return profile. Concerns about Hedge Funds Benefits of Hedge Funds Background Recent Troubles Hedge funds are private investment pools that limit ownership to around 500 high-net-worth investors and do not issue securities to the public. Contrary to common belief, hedge funds have existed since the 1940s. Yet, it is only recent that the talks of regulating hedge funds have heated up. The crash of Long Term Capital Management in 1998 and the demise of Amaranth in 2006 have only added to the debate, and policy innovations from the SEC and other market regulating agencies around the world seem imminent. The proponents for regulation policy argue that the hedge funds pose too much of a threat to global economy to go unregulated and must be curbed to prevent future world-wide financial disasters. However, these policy innovations on regulating hedge funds are unnecessary and may even prove to be harmful to the overall efficiency of the global financial markets and the world economy as a whole. • Former Fed Chair Alan Greenspan believed the Collapse of Long-Term Capital Management “could have potentially impaired the economies of many nations, including our own.” • Hedge funds are limited in what they can disclose to the public at large. • Franz Muntefering, Germany’s deputy chancellor, has complained that hedge funds “remain anonymous, have no face, fall like a plague of locusts over our companies, devour everything, then fly on to the next one.” • IMF estimates hedge funds handle $1 trillion to $1.5 trillion in assets. If hedge funds were a country, it would be the eighth-largest in the world. • Long Term Capital Management • One of the first highly publicized crash of hedge funds. • In 1998 lost around $4.6 billion in less than four month. • The Federal Reserve Bank of New York organized a bail out of $3.625 billion, which is the first known governmental involvement with hedge funds. • Forever linked with the Russian Currency crises and the East Asian financial crisis. Myths about Hedge Funds • Amaranth Advisors LLC • Latest hedge fund to crash. • Roughly had $9 billion in assets shortly before the crash. • Lost $6 billion in a single week on natural gas futures. Myth 1: All Hedge Funds are Highly Leveraged -An IMF study estimates the percentage of funds using leverage in the range of 50 to 70 percent. An estimated 85% of hedge funds have a leverage ratio of two or less. According to JP Morgan, the borrowing amounts to only a little more than the capital in the sector. Myth 2: Hedge funds can manipulate markets. -Studies find little evidence that hedge funds were the market leader during the currency crises. Hedge fund managers are subject to same SEC regulations as any other fund managers. At least in the Mexican and Asian crises, domestic investors played the lead role in dumping the currency. Myth 3: Hedge Funds Increase Market Volatility -Studies suggest that hedge funds engage in negative-feed back trading. The funds’ behavior tends to reduce, not increase, the volatility of prices. Myth 4: Hedge funds are a source of systemic risk. A study done by William Fung and David Hsieh finds that hedge fund returns are largely uncorrelated with those of mutual funds and other classes. Myth 5: Hedge fund managers are not subject to prosecution. -Hedge-fund managers are subject to prosecution just like any regular investor. They are overseen by the SEC, CFTC, the Federal Reserve, and any other overseeing agencies when the laws apply. CISDM Research Department Conclusion • Proliferation of hedge funds actually diminishes the risk of nightmare scenarios, and regulations that discouraged the creation of new funds would be counter productive. • Imposing arbitrary cap on the size of hedge funds would unjustly penalize successful firms. • A regulation forcing disclosure will fail to capture the fund’s real risk as their positions are constantly changing, but could damage incentives of hedge funds to discover and correct market inefficiencies. • The current SEC Chairman Christopher Cox suggested the following: • There should be no interference with the investment strategies or operations of hedge funds, including their use of derivatives trading, leverage, and short selling. Nor should the federal government trammel upon their creativity, their liquidity, or their flexibility. The costs of any regulation should be kept firmly in mind… A hedge fund’s ability to keep confidential its trading strategies and portfolio composition should be protected. Suggested Regulations • Hedge Funds • Organized under the Investment Company Act of 1940. • Regulated under the Securities Act of 1933 and the Securities Exchange Act of 1934. • Common practice to limit the number of investors to 500 in order to be considered a private offering under the Securities Act. • Qualified investors include individuals with at least $5 million in capital and institutional investors with at least $25 million in capital. • Hedge funds are not limited in the financial assets they may hold, including derivative securities. • Hedge funds may be highly leveraged. • Fund manager’s compensation is based on the fund’s financial performance. • Requiring hedge-fund managers both within the United States and outside to register if they have more than 14 U.S- based investors and $30m or more in assets. • Distinguishing hedge fund managers from other discretionary managers/advisers. • Enhanced supervisory oversight by enhancing surveillance of hedge fund managers themselves. • Information gathering and analysis in a systematic fashion to mitigate the risks associated with market quality. • Encouraging improvements in disclosure and due diligence. • Imposing regulatory cap on the size of hedge funds.
The Village Phone: Mobile Phones as a Solution to the Digital Telecommunications Divide Department of Economics, Stanford University, Stanford, CA Background The “global digital divide” is the technological disparity between the world’s rich and poor countries stemming from the scarcity of top-down technological transfers and “trickle-down” effects. While developed nations have benefited from communications technology, poor nations are trailing behind. The unavailability of technology cripples their ability to gather information, coordinate economic activity, and increase their productivity. Mobile phones are a potential solution to this problem. However, the problem therein lies with distribution rather than the technology. The Village Phone Program is a shared-access program pioneered in Bangladesh to address this problem. This poster discusses the economic impact of the Village Phone and its expansion potential after 10 years of operation in Bangladesh. • Future Challenges • Telecommunications monopolies and protectionism impede the Village Phone’s diffusion in many developing countries. In Bangladesh, the program did not spread until after market liberalization in 1996. • Technological barriers, such as high costs of expanding rural wireless coverage and unreliable electricity sources might double future expansion costs (RDH). • Village Phone networks in Bangladesh rely on inefficient GSM technology. Switching to wireless local loops (WLL) or other systems will require significant infrastructural investments or partnerships with other rural providers. • Grameen Telecom’s business model relies on internal subsidies from urban cellular users and financing from Grameen Bank. Such support is unavailable in countries in which microfinance and supporting wireless networks are not already widespread. Diffusion and Growth Microeconomic Effects Consumer Surplus Bangladesh Teledensity Table 1: Alternatives to phone calls in villages without access to a Village Phone, based on a 1998 survey (BBA). • Abstract • This study assesses the Village Phone’s efficacy on macro and microeconomic levels. The findings lead to the following main conclusions: • Shared-access telecommunications can serve as a marketable commodity in rural settings with the support of microfinance institutions. • Policies that support village-level entrepreneurship can be a substitute for aid in alleviating poverty in the developing world. • The exponential diffusion of Village Phones in Bangladesh suggests that there is still significant growth potential in the rural telecommunications market. Furthermore, mobile phone diffusion has shown to have a significant effect on the GDP of Third World countries and has lower expansion costs than landlines. Under favorable policy environments, rural networks, combined with shared access strategies that concentrate demand and generate efficient usage, may enable profitable, market-driven approaches to providing connectivity and infrastructure in rural areas. • Conclusions • Under favorable market conditions, the shared-access approach has the greatest potential for increasing rural telecommunications access. • The high revenues generated by the shared-access model suggest the effectiveness and expansion possibilities of market-driven approaches to development. • Potential benefits of shared-access programs include enhanced productivity, social welfare, and new sources of rural income. • The Village Phone, a shared-access program is still in its exponential growth stages. However, its complete diffusion potential is contingent on the long-term viability of microfinance institutions, future deregulation, and partnerships with WLL-based network companies. Figure 1: In 1997, Bangladesh had one of the lowest number of telephones per 100 people in the world. Mobile phones account for 94% of teledensity growth over the past 10 years (WB). Village Phone Diffusion and Effects on Growth Table 2: Consumer surplus from a phone call ranges from 2.64% to 9.8% of mean monthly household income. Trips to the city cost between 2 to 8 times the cost of a phone call, making real savings per call between 132 and 490 Taka ($2.70 to $10) (BBA). Effects on Gender Equality : References The Economist, Economic Focus, “Calling Across the Divide”. March 10, 2005. Grameen Foundation, “Village Phone: Connecting Technology and Innovation”, Grameen Foundation Website. http://www.grameenfoundation.org/what_we_do/technology_programs/village_phone Keogh, D. and Wood, T., Village Phone Replication Manual, Grameen Technology Center, Grameen Foundation USA, USA, 2005. Bayes, A., von Braun, J., Akhter, R., “Village Pay Phones and Poverty Reduction: Insights from a Grameen Bank Initiative in Bangladesh”. ZEF – Discussion Papers on Development Policy, Bonn University, June 1999. Quadir, Iqbal. “The Power of the Mobile Phone to End Poverty (Speech)”, TED Talks, July 2005. Richardson, D., Ricardo, R., Haq, M. “Grameen Telecom's Village Phone Programme:A Multi-Media Case Study”. Telecommons Development Group, March 2000. The Village Phone Program Figure 2: The number of VPOs in Bangladesh grew from 950 in 1999 to 278570 in 2007. Grameen Bank claims a repayment rate of 98% on its telecommunications loans (GF). • First, a villager in Bangladesh takes out a microcredit loan from a microfinance institution such as Grameen Bank. 2. She uses the loan to purchase a “starter kit”: a phone, coverage and marketing collateral, for between US$250 and US$300 (Keogh, Wood). Figure 4: “Phones have helped elevate the status of the female [VPOs]… VPOs become socially empowered as they earn an income… in rural Bangladeshi society, women usually have no say.” (Keogh, Wood) 3. The now “wireless woman” sells usage of the phone to villagers on a per-call basis. The loan is repaid gradually with business profits. Figure 3: The productivity gains from a single mobile phone contribute $6000 on average to Bangladesh’s GDP. Maintenance cost amount to around $2000 (Qadir). Table 3: Studies show that women have greater control over microcredit loans and Village Phone revenue than other domestic issues (BBA). (650) 799 6977, renfung@stanford.edu
Cable Television: A Look to the Future How Cable Television might become a thing of the past Department of Economics, Stanford University, Stanford, California 94309 Abstract Bass Model Broadcast Satellite: DirecTV/Dish on Demand FiOs Cable Television was the cultural force that redefined television by altering entertainment, sports, news, etc. Developed in 1948 by John Walson, it rapidly grew starting in 1981 largely in part due to popular networks like CNN, CSPAN, ESPN, and MTV. By 2001, it reached an all-time high at 65.7 million subscribers. However, cable television now moves into a more competitive environment in which substitutes have begun to penetrate this monopoly. The main competitors are broadcast satellite which includes DirecTV and Dish Network and FiOS. With these new alternatives offering higher quality, consumers now face decisions that they haven’t in the past. Close substitutes have slowed growth for the number of cable subscribers and will continue to lead to a decline in cable consumers unless cable can match both quality and pricing by offering appealing and comparable bundles. Cable television was once a monopoly but now faces challenges with a new competitive environment. • Until entry of DBS in 1994, most cable firms were local monopolies…entry of satellite brought higher-quality substitute for cable with more channels and a clearer picture. • Offers broadband internet access, digital cable, and VoIP telephone services in fiber optic lines. • First major US carrier in the United States to offer these services. • 10% market penetration by year 2006. • Target: 20-25% market penetration by year 2010. • Of the customers who have subscribed to FiOS TV, 2/3 have discontinued their cable TV service. • Expected to be a serious competitor in the next 10 years. Figure 2 Source: Lilien (1999), http://www.ebusiness.xerox.com/isbm/dscgi/ds.py/Get/File-89/7-1999.pdf Figure 3 Analysis: • The Bass Model predicts that cable television will peak around the year 2005. • This data shows rapid growth with >4% increase each year until 1992. • Between 2003-2005 growth has slowed to <1%. Problem • DBS Two main firms: DirecTV and Dish Network • DirecTV 12.3M by 2002 • Dish Network 9.4M by 2002 • Satellite offers higher quality than most cable tiers: • More channels • Additional sports subscriptions and other programs unavailable to cable consumers • Higher quality reflected in higher prices Cable television was a powerful monopoly but more recently faces a more competitive environment. Close substitutes, Satellite and FiOS, threaten the future for cable and have already slowed down cable growth. The problem is whether cable can remain a dominant force, and if so, what changes need to be made. Reasons for slowed growth: New substitutes penetrating the Cable Monopoly Conclusion Although cable television met with early on success and continues to dominate, the future predicts the decline in number of subscribers to cable as a result of emerging competitors penetrating the monopoly of the past. As a result of competition, cable networks are forced to meet the quality of satellite alternatives which implies increasing prices, or eventually losing all subscribers to their more appealing substitutes. It is possible to coexist but satellite and FiOS penetration is increasing yearly and cable must restructure in order to keep up. Cable Television Historical Data Adoption Prediction for Cable Alternatives Figure 4 Satellite Subscriptions are slowly penetrating the cable monopoly starting in 1995… increasing satellite rates are matched with declining cable growth rates. Works Cited Abaye, Ali. R, Babbitt, Best, Hu, Maveddat. “Forecasting Methodology and Traffic Estimation for Satellite Multimedia Services” Strover, Sharon. “United States: Cable Television” NCTA Cable Industry Statistics Lilien (1999), http://www.ebusiness.xerox.com/isbm/dscgi/ds.py/Get/File-89/7-1999.pdf Figure 1 Cable Response: 60.3% cable markets induced by satellite to increase quality at the expense of increasing prices in order to remain competitive. • Cable chooses combination of price and quality in order to appeal to consumer types that might switch to satellite however satellite penetration is increasing and predicted to reach around 82 million homes by 2010. Cable Television Development: 4 Phases • 1948-1965: slow growth • 1965-1975: FCC attempt to restrict cable television to non-urban markets (forms local media service) • 1975-1992: regulatory acts and expansion across country…promotion of new satellite-delivered programming services • 1992-present: moves into more competitive environment • Adoption for multimedia application results show broadband and satellite networks have window of opportunity for capturing sizeable portion of emerging multimedia market starting mainly in 2002. Cable rates have begun to decline starting in 2002 as seen in Figure 1. Acknowledgements Thank you to Dr. Ward Hanson and Andrea Pozzi for all their assistance throughout.
No Child Left Behind: Closing the Achievement Gap in California Public Schools B.A. Candidate, Department of Economics, Stanford University Abstract In January 2002, President Bush signed theinnovative No Child Left Behind Act (NCLB) into federal legislation with the goal of improving the performance of students in U.S public schools. NCLB tests every child in grades 3-8 and uses the scores to create report cards for every school so that parents can see the successes or failures of the local public education. If their school is not making adequate yearly progress NLBC requires that school districts notify the parents and offer alternatives for better education. I will: Data National Assessment of Educational Progress (NAEP) measures students' achievement in many subjects, including reading and mathematics. Under No Child Left Behind, as a condition of receiving federal funding, states are required to participate in the NAEP math and reading assessments for fourth- and eighth-grade students every two years. I am using eighth grade data in reading and mathematics for California public schools and for the national average of public schools. Weaknesses of NCLB: Reading The average scale scores in Reading in California has been erratic, both rising and falling, appearing almost stagnant over time. After the implementation of the NCLB act, the average score decreased. Strengths of NCLB: Mathematics The average scale scores in Mathematics in California has generally increased every year since 1978. After the implementation of the NCLB act in 2002, the average score jumped significantly to an all-time high in 2004. • chart students performance in mathematics and reading in grade 8 in California public schools • compare pre-NCLB score results with post-NCLB scores in order to see if performance has increased • chart the national average scores vs. California’s average scores and • discuss the strengths and weaknesses of the act, using the National Assessment of Educational Progress (NAEP) data • compare score performances between different races/ethnicities to see whether the achievement gap is closing. California State Profile: Number of schools: 9,690Number of students enrolled: 6,441,557 Racial/Ethnic Background:White: 31.9% Black: 8.1%Hispanic: 47.7%Asian/Pacific Islander: 11.5% The following graph more clearly shows the rise in scores after 2002. However, the gap between California school scores and the national average school scores is increasing. California is not improving at the same rate as the rest of the country. The following graph shows how both California school scores and the national average school scores have decreased since 2002. The gap between the two has remained fairly stagnant. • Conclusions • 1). The NCLB act has had mixed results on subject score reports. While mathematics scores have increased since implementation, reading scores have decreased. A subject-specific analysis is necessary since the current standardized test may only improve the scores in certain subjects. • 2). California public schools do not perform as well as the national average. In order to improve performance, the federal and state governments must provide more funding to schools. Without better resources and teachers, California will continue to lag behind other states. • 3). The achievement gap is still a serious problem. While math scores have improved among all races and ethnicities, the difference between the groups has not decreased. Whites and Asian Americans continue to perform better than Blacks and Hispanics in Math and in reading. As California’s population rises, extra effort to teach reading may be necessary – including after-school initiatives and more programs in ESL (English as Second Language). • 4). Since the NCLB has achieved mixed results, it is necessary for policymakers to reevaluate the system. Because it has achieved significant improvements in mathematics, the system does not need to be abandoned, but better suited to help under-performing states and closing the achievement gap among ethnicities. Motivation One of the nation’s most pressing problems is the inequality of public education. The performance of primary and secondary students differs among states and also among race and ethnicities, creating an achievement gap. The performance of Black and Hispanic students improved during the 1970s and 1980s, but in the 1990s, the achievement gap remained stagnant or grew. An innovative solution to the achievement gap became an imperative policy goal for the new administration. In order to address the achievement gap, the NCLB act creates an incentive for public schools to implement national standards for every student. Standardized tests provide available data for school districts, teachers, and parents in order to evaluate each school. After five years of implementation, politicians and policymakers are evaluating the success of the act in improving student performance. If appropriate progress has not been achieved under NCLB, policymakers will have to reevaluate the system. The following graph highlights the achievement gap between race and ethnicities. Blacks and Hispanics perform at a much lower level than Whites and Asian American/Pacific Islanders. Furthermore, the scores for Whites and Blacks have decreased since the NCLB act. The following graph shows the rise in scores over time regardless of race and ethnicity. Each ethnicity improves in score in roughly the same proportion. However, the difference in average scale scores between ethnicities is significant, with Blacks and Hispanics underperforming. Goals Analyze data in graphs to investigate the impact of NCLB on public school performance and use the results to determine strengths and weaknesses of the act. Specifically, we want to determine the impact of the NCLB act on: • Reading and mathematics scores in California, grade 8, before and after implementation in 2002 • California public school scores vs. the national average of public school scores • Closing the achievement gap between race and ethnicities in California. For More Information For data: http://nces.ed.gov/nationsreportcard For NCLB: http://www.ed.gov/nclb/overview/ Please contact with questions.
Efficient Decongesting Mechanisms: Congestion Pricing and Intermodal Systems Department of Economics, Stanford University, Stanford, California 94305 • Congestion Pricing • Congestion pricing can be considered a Pigovian tax, designed to correct negative market externalities. In this scenario, roads are supplied by the city for drivers, but it is the city’s pedestrians, workers, and residents who must deal with the negative effects of congested streets. • London Case Study • In 2003, London mayor Ken Livingston introduced congestion pricing, a tax paid by drivers who clog up the city’s most congested areas, such as finance districts, government office areas, and major tourist destinations. • Prior to congestion charging 40,000 vehicles an hour drove every morning into central London. • This traffic resulted in drivers in central London to spend 50 percent of their times in jams, costing the city £2 to £4 million a week. • 136,000 residents live within charging zones. • £ 8 congestion charge addresses transport priorities for London: • Reducing congestion • Improving bus services • Improving journey time reliability for car users. • Making distribution of good and services more reliable, sustainable and efficient. Results • Congestion in the zone has dropped by around 30 percent and is now lower than any stage since the mid-1980’s. • There are 50,000 fewer motor vehicles entering charge zone per day, this represents a 16% drop. • Journey times in the center have decreased by approximately 14% percent and reliability has improved by an average 30%. • Payment schemes working well, over £68 million were raised in 2003/04 and has been steadily increasing and expected to plateau at £130 million per year. • - Revenue is spent on bus network improvements, increasing late-night transportation, and expanding Underground and rail capacity with new services across central London. Background • Intermodal Passenger Systems • Basic definition: Being or involving transportation by more than one form of carrier during a single journey. • Motivation: Establish efficient movement of passengers between modes of transit thus reducing travel time and dependence on passenger vehicles. • Amsterdam • Rail networks are the city’s high-speed backbone while people get around locally by bike. • City has linked both systems by planning bicycle lanes as feeder systems for rail stations and by building extensive bicycle parking. • Hong Kong • Intermodal hubs link regional and international networks. • - High-speed rail systems link the international air terminals with downtown station for subways, ferries and double-decker street cars. A Perfect Hybrid Congestion pricing alone cannot change the way a city’s population moved around, it is of paramount importance for there to exist alternative modes of transportation readily available for commuters to use. - London had well developed alternative modes of transportation including the Underground, an efficient bus system, as well as a well developed rail system providing commuters easy access to the center. Congestion pricing has proven to be a profitable mechanism for internalizing the externalities brought forth by congestion. A congestion pricing plan along with a well developed intermodal system will offer cities an opportunity to capitalize on transportation resources while allowing them to continuously seek to improve them. The past few decades have presented dramatic changes for world demographics; the global population has risen to over 6.7 billion persons and the concentration of population has shifted away from rural to urban centers. This shift has presented myriads of difficulties for metropolises across the globe in that many suffer from problems relating to overpopulation and inadequate city planning. Amongst the greatest problems plaguing these cities is over-congestion due to saturated transportation systems that have become obsolete due to a dramatic increase in motor vehicles. There are approximately 600 million motor vehicles in circulation today, if the current trend persists it is estimated this amount will double to 1.2 billion motor vehicles by 2030. Given the length of time it takes to plan and prepare, it is of paramount importance for the public and private sectors to develop mechanisms encouraging the use of public transportation so that congestion issues can be resolved. Figure 5. Gare du Nord Train Station in Paris links international and domestic rail systems with the City’s extensive subway system. The Station also provides easy access to Paris’s international and domestic air terminals. Literature Cited Goetz, Andrew R., and Timothy M. Vowles. Progess in Intermodal Passenger Transportation: Private Sector Initiatives. University of Denver. Denver. Janic, Milan, and Yvonne Bontekoning. "Intermodal Freight Transport in Europe: an Overview and Prospective Research Agenda." OTB Research for Housing, Urban and Monbility Studies; Delft University of Technology. "Technology and Traffic Management: London Case Study." Making the Modern World. 23 May 2007 <http://www.makingthemodernworld.org.uk/learning_modules/geography/>. Figure 3. Clear signs at Hong Kong International Airport show different types of transport to center. Figure 1. Heavy congestion in downtown London during rush hour Figure 2.The white-on-red C marks all entrances to the congestion charge zone. Congestion charge was originally introduced at a price of £5 per day. Congestion charge has recently risen to £8 a day, approximately $16. For further information Figure 4. Airport Express is the most direct route Connecting airport with city center in 24 minutes. Please contact if you have any questions.
The World’s First Eco-City—Dongtan, China , Dept. of Economics, Stanford University Abstract Project Dongtan Financing & Incentives Is Dongtan Cost-Effective? (II) • Strong Financing: • Quasi-public funding: 100% financed by the Shanghai Industrial Investment Corporation (SIIC), a conglomerate fully funded by the Shanghai Municipality. • Strong government backing: The land of Dongtan was given to SIIC by the Shanghai government in order to replenish the company’s assets during the 1997 economic downturn. Keeping Dongtan green is a key feature of the deal. • Aligned Incentives across players: • Arup: Successful carry-out of the project is (1) a means to further its establishment in Asia, and is also (2) a major commercial opportunity to recruit international clients interested in sustainable urban development by leveraging the firm’s first mover advantage from engineering the eco-city. • SIIC: (1) Has agreement with the Shanghai government to keep Dongtan ecologically sustainable; (2) SIIC will showcase the progress of Dongtan in the 2010 Shanghai World Expo. Due to large-scale industrialization and rapid urbanization, China is in desperate need of sustainable development. China is currently involved with one of the world’s most substantial sustainable development project by building the Dongtan Eco-City—the world’s first true eco-city designed to be carbon neutral, self sustainable, and to have a minimal ecological footprint. In answering the overarching question of whether the ambitious Dongtan project will succeed, the paper examines its funding sources and the incentive mechanisms between players. The paper then performs a cost-effectives analysis to see if Dongtan’s goals are reached with least cost. Lastly, the paper factors in the project’s potential to be a diffusible innovation, and concludes on Dongtan’s prospects. • Goals: (1)To provide sustainable urban living with a minimal ecological footprint for half a million people, and (2) to be a template for urban development elsewhere in China and the world. • Who: Commissioned by the partly state-owned Shanghai Industrial Investment Corporation (SIIC) to the British design and engineering firm Arup. • Where: Dongtan will be built on Chongming Island, China’s third largest island, in the Yangtze River Delta, 15 km north of Shanghai, on an area of land near the size of Manhattan. • When: By 2010 it will be a city of 25,000, and by 2050 a city of 500,000. • Cost:The initial phase of Dongtan will cost around $2.5 billion, but the entire cost of the project is expected to be in the double-digit billions. • Project Description: • The city will consist of compact villages intersected by canals and lakes. The layout will minimize the need for petroleum-based transportation. • The entire transport system (cars, trams, buses, boats) will be powered by electric motors or hydrogen fuel cells. • Highly energy efficient buildings (1/3 of typical energy consumption) with their own photovoltaic solar panels. • City largely powered by renewable energy—other than solar energy, wind turbines will generate 20% of the city’s energy needs and biomass energy production from rice husk wastes will generate most of the city’s electricity. • Waste would be either recycled or composted—the bulk of its organic wastes will be returned to local farmlands, and no more than 10% of the city’s trash would end up as landfill. • Sewage will be cleaned mainly using decentralized biological treatment systems that will capture the nutrients in the waste water. Green rooftops will collect, filter, and store water as part of the city’s water system. • 60% of Dongtan will remain agricultural, where organic-farming techniques linked to the waste and sewage recycling system are designed to create a sustainable cycle of local food production. • A larger number of research institutes from eco-industries will form a major component of Dongtan’s economy. Examine goal 2 (to serve as a model for sustainable living in order to be a catalyst for changes in other cities): Assuming that the collective costs of living of citizens are the same regardless of which city they live in—can more change be catalyzed with 500,000 citizens living in one model city or with 500,000 model citizens living in different cities throughout China? 500,000 people living in a model city will serve as a much stronger catalyst for change, since a collective program will receive much stronger publicity and its template of sustainability could be passed on to other cities new or old, domestic or international. Whereas 500,000 model citizens living throughout China would only produce scattered influences. YES! Dongtan: Diffusible Innovation? • Eco-cities do not fit into the natural diffusion model of innovative consumer products. • Condition to diffuse is strong government support or funding in countries where (1) urbanization causes significant environmental and health problems, where (2) the pursuit of large-scale sustainability projects can offset enough of these harms to justify their costs, and where (3) bureaucracy is not cumbersome. • Private initiation usually ends in failure due to funding and incentive issues, e.g. Arcosanti, Epcot, Huangbaiyu. • China satisfies the condition and has 4 eco-cities in the pipeline—Dongtan will serve as a blueprint for them. • Global impacts so far: • Mayor of London visited Dongtan to ideas for a huge zero-emission development about to break ground in east London. • Arup would also apply lessons from Dongtan to new developments in San Francisco and Napa County. Is Dongtan Cost-Effective? (I) The Need for Urban Sustainability • Cost effectiveness means reaching a goal with least cost… • Examine goal 1 (to provide more sustainable living): • The improvements Dongtan brings in sustainable living per year (i.e. the projected difference in resource use if Dongtan’s residence were instead living in a traditional city) are: • 24,560 million stere of waste gas • 5 million tons of solid waste • 5.92 million tons of untreated waste water • This is estimated by giving a 20% discount to the pollution statistics of a tradition Chinese city, Qinhuangdao, which has the same population as Dongtan. This assumes that if Dongtan’s residences were to live in a traditional city instead, their living patterns would be similar to that of Qinhuangdao’s. Data is provided by China’s State Environmental Protection Administration (SEPA). • The costs of building facilities to treat pollution for an average city is: • 50.4 stere of waste gas / yuan • 0.27 tons of waste water / yuan • This is estimated by averaging the (amount treated / cost) of 11 Chinese cities, based on numbers provided by SEPA, e.g.: • Hence, to achieve the improvements of Dongtan by implementing sustainability development in currently-built cities would cost: • 487.3 million yuan to treat waste gas (=$63.66 million) • 21.92 million yuan to treat waste water (=$2.86 million) • So, it costs $65.6 plus a certain amount for solid waste, together which comes to hundreds of times less than the double-digit billions it would cost to build Dongtan. NO! • China is the world’s most populous country, with a fast growing economy and rapid urbanization. China’s urban population is expected to reach 1.1 billion by 2050. By then nearly half of China’s current population will have moved from rural to urban areas. This process is already having detrimental effects on the urban living environment. The benefits of China’s record economic growth could effectively be undone by the ever-growing costs of resource depletion, pollution and damage to human health. For example, sulfur-dioxide emissions alone are causing China’s GNP an annual loss of 12%. • Heavy Industrialization: • One third of China’s water courses are severely polluted • Has 16 of the world’s 20 most polluted cities • Builds a coal power station a week • World No. 1 emitter of SO2 • Will be the world No. 1 emitter of CO2 in 2008 • Air pollution causes 400,000 premature deaths a year • Rapid Urbanization: • By 2050, 600 million people will move from rural to urban areas in China • By then, China will have 50 mega cities (> 2 million people), 150 big cities, 500 medium-sized cities, and 1,500 small cities as urbanization rate rise from 36% to 70% • As China’s per capita resource consumption is catching up with Western countries, sustainable development is key to prevent a pending environmental catastrophe. Conclusion • With strong financing and aligned incentives, Dongtan has the right elements to succeed. • However, Dongtan is far from being cost-effective using the environmental benefits it aims to achieve as a reference. • This is compensated by its potential to catalyze further sustainability developments globally by serving as a pioneering example. • As its innovations could be applied to both new cities and already-built cities, the Dongtan model could be a real solution to rapid urbanization if it works out. • The Shanghai World Expo in 2010 will be the time to critique Dongtan’s progress. Key References • Yan, Zhao, and Herbert Girardet. Dongtan: An Eco-City. SIIC • and Arup, 2006 • Girardet, Herbert, and Peter Head. “City of the Future: Is • Dongtan a New Urban Development Paradigm?” Living for the • City: A New Agenda for Green Cities. Ed. Jesse Norman. Policy • Exchange, 2006. 139-151. • Arup. Dongtan Eco-City. • <http://www.arup.com/eastasia/project.cfm?pageid=7047>