Download
1 / 18
180 likes | 279 Views
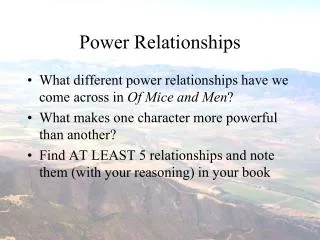
Strategies and Rubrics for Teaching Chaos and Complex Systems Theories as Elaborating, Self-Organizing, and Fractionating Evolutionary Systems. Fichter, Lynn S., Pyle, E.J., and Whitmeyer, S.J., 2010, Journal of Geoscience Education (in press) . Power Law Relationships.

E N D
Strategies and Rubrics for Teaching Chaos and Complex Systems Theories as Elaborating, Self-Organizing, and Fractionating Evolutionary Systems Fichter, Lynn S., Pyle, E.J., and Whitmeyer, S.J., 2010, Journal of Geoscience Education (in press)
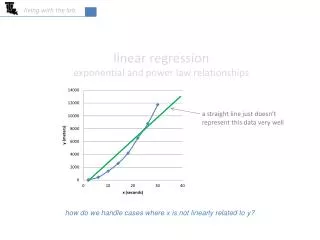
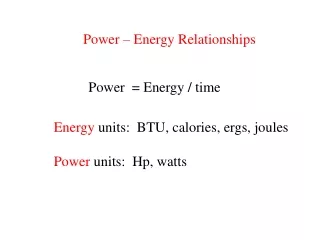
Comparing Linear, Exponential and Non-Linear Changes Y = mx + b Linear, if we graph it we get a straight line In general, if the right hand side is all pluses, minuses, multiplication, and/or division. Non-Linear, if we graph it we get an curve. Y = X2 In general, if the right hand side has powers, sines, cosines, or other fancy stuff it is non-linear The rate of change changes
Comparing Linear and Non-Linear Changes Stasis: no change through time 8 7 6 5 Punctuational change Gradual change through time 4 Time 3 2 Linear change Non-linear change through time 1 1 2 3 4 5 6 7 8 9 10 Asymptopic or exponential Evolutionary Change
103 102 101 100 100 101 102 103 104 Comparing Linear and Non-Linear Changes 8 7 6 5 4 The asymptopic curve now plots as a straight line 3 2 Non-linear change through time 1 1 2 3 4 5 6 7 8 9 10 Asymptopic or exponential
Power Law Relationships 1. Non-whole Dimensions Log (number of similar pieces) Fractal Dimension = Log (magnification factor) N = M D N = # of new pieces M = magnification D = dimension For example, a crumpled piece of paper has a dimension of ~ 2.5, and the size of the spaces follows a power law Fractal objects follow a power law; and things that follow a power law are fractal. http://classes.yale.edu/fractals/FracAndDim/BoxDim/PowerLaw/PowerLaw.html
Comparing Linear and Non-Linear Changes Do very little work Lots of small events A Power Law Distribution 107 106 105 104 Frequency 103 102 101 Very rare large events 100 Do the vast majority of the work 100 101 102 103 104 105 106 107 108 109 Energy
Universality Properties of Complex Evolutionary Systems Power Law Relationships – Cotton Prices Mandelbrot’s (1963) analysis of monthly variations in cotton prices during a 30 month period. The left plot shows the month by month changes. Note how they vary; lots of small changes, and fewer large changes. The right logarithmic graph shows the same data is a power-law distribution, indicating the cotton commodities market is at the critical level (SOC). Other commodities follow a similar pattern.
Universality Properties of Complex Evolutionary Systems Power Law Relationships - Earthquakes http://www.hsv.com/genlintr/newmadrd/ http://www.msstate.edu/dept/geosciences/CT/TIG/WEBSITES/LOCAL/Summer2003/Thomas_Donna/newmadrid.html
Universality New Madrid, Missouri Earthquakes Properties of Complex Evolutionary Systems Power Law Relationships - Earthquakes http://keller.clarke.edu/~english/honors/jen/
Universality Properties of Complex Evolutionary Systems Power Law Relationships – Natural Disasters Plot of cumulative frequency of dollar loss due to earthquakes and hurricanes in the U.S. between 1900 and 1989. Data presented in this manner reveal linear trends which provide the basis for forecasting the probability of future dollar loss. http://pubs.usgs.gov/fs/natural-disasters/figures/fig3.html
Universality Properties of Complex Evolutionary Systems Power Law Relationships – Natural Disasters Comparison of natural disaster fatalities in the United States. Cumulative size-frequency distributions for annual earthquake, flood, hurricane, and tornado fatalities. In addition to demonstrating linear behavior over 2 to 3 orders of magnitude in loss, these data group into two families. Earthquakes and tornadoes are associated with relatively flat slopes (D=0.4 - 0.6); while floods and tornadoes have steeper slopes (D=1.3 - 1.4). Open symbols were not used to calculate slope of lines. http://pubs.usgs.gov/fs/natural-disasters/figures/fig3.html
Universality Properties of Complex Evolutionary Systems Power Law Relationships – Natural Disasters Plot of cumulative frequency of dollar loss due to hurricanes, earthquakes, and floods in the U.S. Data presented in this manner reveal linear trends which provide the basis for forecasting the probability of future dollar loss. http://coastal.er.usgs.gov/hurricane_forecast/hurr_losses.html
Universality Properties of Complex Evolutionary Systems Power Law Relationships - Extinction
Universality Properties of Complex Evolutionary Systems Power Law Relationships – Zipf’s Law Formulated by George Kingsley Zipf who observed a number of striking observations about patterns in human systems. Two prime examples, word usage in the English (and other) languages, and distribution of city population sizes. Both follow a power-law distribution. Both of these examples imply these systems are evolving at the critical level.
Comparing Linear and Non-Linear Changes Lots of small events A Power Law Distribution 107 106 105 104 Frequency 103 102 101 Very rare large events 100 The Perfect Storm 100 101 102 103 104 105 106 107 108 109 Energy
The Perfect Storm The phrase perfect storm refers to the simultaneous occurrence of events which, taken individually, would be far less powerful than the result of their chance combination. The book/movie is about the Halloween Nor'easter that hit North America in October 1991. Such occurrences are rare by their very nature, so that even a slight change in any one event contributing to the perfect storm would lessen its overall impact.
Learning Outcomes 13. Power Law Distributions Small – low energy – events are very common, but do very little work. Large – high energy – events are very rare, but do most of the work in a system.