Download
1 / 11
110 likes | 271 Views
Flow Measurements of Power Plant Discharges Using Thermal Imaging. David Admiraal UNL CE John Stansbury UNL CE Donald Rundquist UNL SNR Dennis Alexander UNL EE Junke Guo UNL CE Mike Drain CNPPID. Laboratory Measurements of Surface Velocity in a Flume 70 cm Wide, 10 m Long Flume

E N D
Flow Measurements of Power Plant Discharges Using Thermal Imaging David Admiraal UNL CE John Stansbury UNL CE Donald Rundquist UNL SNR Dennis Alexander UNL EE Junke Guo UNL CE Mike Drain CNPPID
Laboratory Measurements of Surface Velocity in a Flume • 70 cm Wide, 10 m Long Flume • Five Discharges • Five Depths • Four Seeding Rates • Discharge Measured Independently with Weir • Surface Temperature Measured with Thermal Imaging Camera Mounted 2 m Above Water Surface
Laboratory Measurements of Surface Velocity in a Flume Sample AVI of Seeded Flow
Laboratory Experimental Results Flow Seeded with Hot Water Time 1: 0.000 s Time 2: 0.264 s
Velocity Vector Determination By Tracking Thermal Structures Two Algorithms for Seeded Flow Contouring of Thermal Gradients Unaltered Image By Filtering or manipulating the thermal data we can improve vector calculations (note improvement in vector calculation for the image on the right)
Discharge Calculation Results Using Surface Velocities From Contoured Images Shown in Previous Slide • Average Surface Velocity Measured with Thermal Camera: 0.309 ft/s • Depth-Averaged Velocity Calculated using Power Law: 0.271 ft/s • Discharge Computed using Depth-Averaged Velocity and Flow Area: 0.397 cfs • Discharge Measured with Weir: 0.378 cfs • Percent Difference between Calculated and Measured Discharge: 5%
Laboratory Experimental Results Unseeded Flow Time 1: 0.000 s Time 2: 0.264 s Note that images have been manipulated to show that there is observable motion of structures. Some of the structures have been circled in the images.
Velocity Vector Determination By Tracking Thermal Structures One Algorithm for Unseeded Flow Thermal Gradients have been Contoured and Images have been Filtered to Reduce Noise Contouring and filtering vastly improves vector results, but many of the vectors are still biased to zero because of the correlation algorithm. We are currently attempting a new algorithm called Minimum Quadratic Difference (MQD)
Summary • It is feasible to accurately measure surface velocity in seeded flows • It appears to be feasible to accurately measure surface velocity in unseeded flows, but a more robust algorithm will be important to reduce the effects of noise • Choice of image interrogation algorithms and filtering can improve velocity measurement results
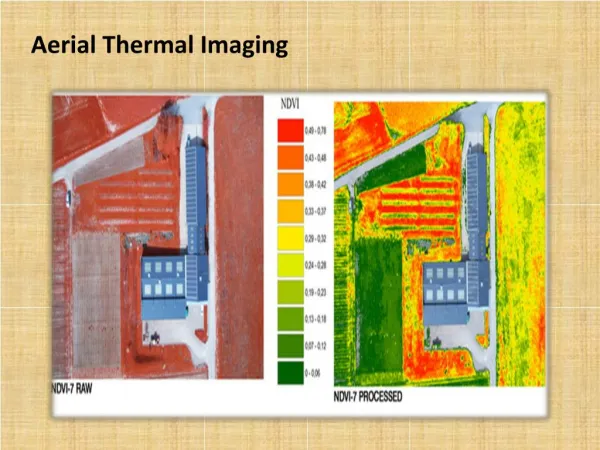
Sample of Aerial Measurements at Gerald Gentleman Station Cooling Pond
Field Measurements of Surface Velocity in GGS Cooling Pond Sample AVI