Download

1 / 49
520 likes | 922 Views
PV92 PCR Informatics Kit: Where did you get those GENES?. Chromosome 16: PV92 PCR Informatics Kit Instructors. Sherri Andrews, Ph.D. Curriculum and Training Specialist Bio-Rad Laboratories Essy Levy, M.Sc. Curriculum and Training Specialist Bio-Rad Laboratories.

E N D
PV92 PCR Informatics Kit: Where did you get those GENES?
Chromosome 16:PV92 PCR Informatics KitInstructors Sherri Andrews, Ph.D. Curriculum and Training Specialist Bio-Rad Laboratories Essy Levy, M.Sc. Curriculum and Training Specialist Bio-Rad Laboratories
WhyTeach Polymerase Chain Reaction (PCR)? • Powerful teaching tool • Real-world connections • Link to careers and industry • Tangible results • Laboratory extensions • Standards-based
Chromosome 16:PV92 PCR Informatics Kit Advantages • Aligns with AP Biology AP Lab 8 • Extract genomic DNA and amplify student samples • Introduce the polymerase chain reaction (PCR) • Apply PCR to population genetics • Directly measure human diversity at the molecular level • Compare results to online data • Sufficient materials for 8 student workstations • Complete activity in three 45 minute sessions
Chromosome 16:PV92 PCR Informatics KitWorkshop Timeline • Introduction • Extract genomic DNA and prepare samples for PCR • Cycle samples • Agarose gel analysis • Hardy-Weinberg analysis • Bioinformatics
Chromosome 16 PV92 PCRProcedure Overview Day 2 Day 1 Day 3
What Is PCR? • DNA replication gone crazy in a test tube! • Makes millions of copies of a target sequence from template DNA • Uses heat-resistant Taq polymerase from Thermus aquaticus
Micropipet Use 1. Twist dial to desired volume 2. Pick up pipet tip 3. Press plunger to first, soft stop 4. Insert pipet tip into solution to be transferred 5. Slowly release plunger to retrieve liquid 6. Move pipet tip into desired tube 7. Press plunger past first stop to second, hard stop to transfer liquid
Protocol Highlights Genomic DNA Extraction • InstaGene™ - Chelex® cation exchange resin; binds cellular magnesium ions • 56°C - loosens connective tissue and inactivates DNAses • 100°C - ruptures cell membranes and denatures proteins
InstaGene Extraction Cell membrane Nuclear membrane Mg++ Genomic DNA Mg++ Mg++ Mg++ Mg++ Heat disrupts membranes InstaGene matrix binds released cellular Mg++ Mg++
3’ 5’ 5’ 3’ Forward primer Reverse primer 3’ 5’ 5’ 3’ Target sequence What Is Needed for PCR? • Template (the DNA you want to amplify for the study) • Sequence-specific primers flanking the target sequence: • Nucleotides (dATP, dCTP, dGTP, dTTP) • Magnesium ions (enzyme cofactor) • Buffer, containing salt • Taq polymerase
How Does PCR Work? • Heat (94°C) to denature DNA strands • Cool (60°C) to anneal primers to template • Warm (72°C) to activate Taq polymerase, which extends primers and replicates DNA • Repeat multiple cycles
Denaturing Template DNA Heat causes DNA strands to separate 5’ 3’ 5’ 3’ Denaturation of DNA at 94°C 3’ 5’ 3’ 5’
5’ 3’ 5’ 3’ 5’ 3’ 3’ 5’ Annealing Primers • Primers bind to the template sequence • Taq polymerase binds to double-stranded substrate 3’ 5’ 3’ 5’ Primers anneal at 60°C
Taq Polymerase Extends… • Taq polymerase extends primer • DNA is replicated 3’ 5’ 5’ 3’ 5’ 3’ 5’ 3’ Extends at 72°C 5’ 3’ 5’ 3’ 5’ 3’ 3’ 5’
Exact-length Target Product is Made in the Third Cycle Cycle 1 5’ 3’ 5’ 3’ 5’ 3’ 3’ 5’ Cycle 2 3’ 5’ 5’ 3’ 3’ 5’ 3’ 5’ Cycle 3 3’ 5’ 3’ 5’ 5’ 3’ 5’ 3’
The Target Sequence • PV92 Alu insertion • Located on Chromosome 16 3’ 5’ Alu Amplified Region
PV92 Alu Insertion • A member of Alu repeat family • Human-specific Alu insertion • Found in a non-coding region of your DNA • Not diagnostic for any disease or disorder 3’ 5’ Alu Amplified Region
PCR Results • The PV92 Alu is dimorphic so there are two possible PCR products: 641 bp and 941 bp No insertion: 641 bp With Alu: 941 bp 300 bp Alu insert 641 bp 3’ 5’ Alu Amplified Region
Actual Alu PCR Results - +/- + 941 bp 641 bp - + +/-
AluRepeats • Classified as SINEs (Short Interspersed Repetitive Element) • Mobilized by an RNA polymerase-derived intermediate (retroposition) • Approx. 500,000 Alu copies per haploid genome, representing about 5% of the genome • Named for the Alu I restriction site within the element
Evolutionary Significance of PV92 Alu Inserts • Highly conserved • Inserted in the last 1,000,000 years • Genotypes (+/+, +/–, –/–) • Used in population genetics, paternity analysis, and forensics
Determination and analysis of Alu Frequency in a population • Amplify Alu insert from representative sample population • Calculate the expected allelic and genotypic frequencies • Perform Chi-square test
Calculating Observed Genotypic Frequencies Genotype +/+ +/– -/- Total (N) # of People25 5 8 38 Observed0.66 0.13 0.21 1.00 Frequency +/+ Genotypic frequency Number with genotype Population total (N) = 25 38 = = .66
Number of + alleles 25 individuals with two + alleles = 50 + alleles 5 individuals with one + allele = 5 + alleles Total = 55 + alleles Total number of alleles 2N = 2(38) = 76 Calculating Allelic Frequencies p Frequency of + alleles = = Number of + alleles Total number alleles 55 76 = = 0.72 p = 0.72; therefore q = 0.28 since p + q = 1.00
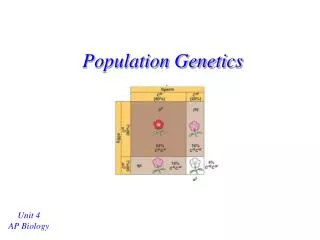
p q +/+ = p2 +/- = 2pq -/- = q2 p pp pq q pq qq Alu and Population Genetics Hardy-Weinberg Equation p2 + 2pq + q2 = 1
Using theHardy-Weinberg Equation to Determine Expected Genotypic Frequencies(p2, 2pq, q2 values) p2 + + = 1.00 2pq q2 + + = 1.00 (0.72)2 2(0.72)(0.28) (0.28)2 + + = 1.00 0.52 0.40 0.08 p2 = 0.52 2pq = 0.40 q2 = 0.08
Calculate Expected Numbers for Each Genotype +/+ (p2) +/– (2pq) –/– (q2) Genotype frequency Populationtotal (N) Expected number x = x = 0.52 38 20 x = 0.40 38 15 Genotype x = 0.08 38 3
∑ (Observed – Expected)2 X2 = Expected Chi-Square Test X2 critical value (from statistics table) = 5.9 +/+ +/– –/– 16.25 is above 5.9 so the observed genotypic frequencies are not in genetic equilibrium (O–E)2 E Observed Expected 25 20 1.25 5 15 6.67 Genotype 8 3 8.33 X2 = 16.25
Allele Server(1 of 17) Cold Springs Harbor Laboratory DNA Learning Center Web site: http://www.dnalc.org/
Allele Server(2 of 17) Scroll through DNALC internet sites until BioServers Link appears
Allele Server(13 of 17)Add Each Student’s InformationAdd as much information as possible:• Genotype (+/+, +/–. –/–)• Gender• Personal Information
Allele Server(16 of 17)Analyze Data 2: Then Click Here 1: Click Here First
Allele Server(17 of 17)Click on the Terse and Verbose Tabs to Review Data Results
Extensions • Add each class separately and compare to see if the classes different from each other • Compare your group to other existing groups • Have students do manual calculations first and then compare to the computer generated version