Download
1 / 4
40 likes | 139 Views
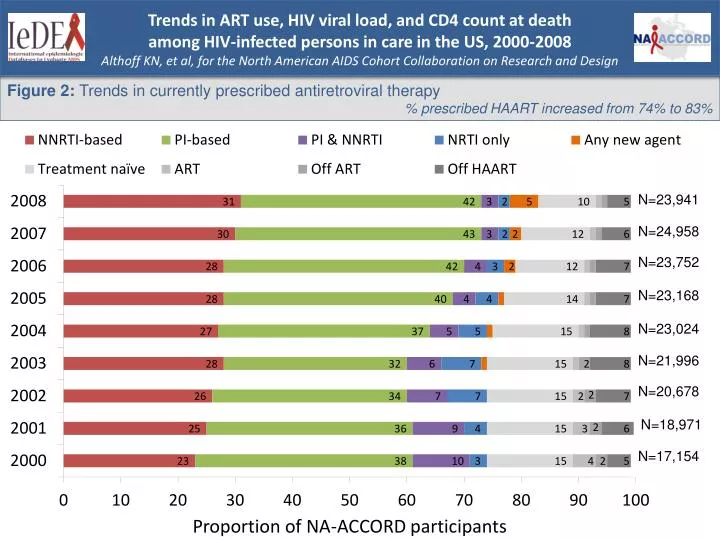
Trends in ART use, HIV viral load, and CD4 count at death among HIV-infected persons in care in the US, 2000-2008 Althoff KN, et al, for the North American AIDS Cohort Collaboration on Research and Design. Figure 2: Trends in currently prescribed antiretroviral therapy

E N D
Trends in ART use, HIV viral load, and CD4 count at death among HIV-infected persons in care in the US, 2000-2008 Althoff KN, et al, for the North American AIDS Cohort Collaboration on Research and Design • Figure 2: Trends in currently prescribed antiretroviral therapy • % prescribed HAART increased from 74% to 83%
Trends in ART use, HIV viral load, and CD4 count at death among HIV-infected persons in care in the US, 2000-2008 Althoff KN, et al, for the North American AIDS Cohort Collaboration on Research and Design Figure 3: Trends in the proportion with suppressed (≤2.7 log10 or ≤500 copies/mL) HIV VL and mid-year HIV VL, by antiretroviral therapy status % suppressed increased from 46% to 72%, regardless of treatment
Trends in ART use, HIV viral load, and CD4 count at death among HIV-infected persons in care in the US, 2000-2008 Althoff KN, et al, for the North American AIDS Cohort Collaboration on Research and Design Figure 4: Median CD4 count within 18 months prior to death (N=4,417 decedents) Median CD4 count tripled to 209 cells/mm3
Trends in ART use, HIV viral load, and CD4 count at death among HIV-infected persons in care in the US, 2000-2008 Althoff KN, et al, for the North American AIDS Cohort Collaboration on Research and Design Figure 1: Unadjusted percentages of PLWH-US within 50 states and the District of Columbia, that were alive and in care among US clinical cohorts participating in the NA-ACCORD, (N=23,884), by state, year-end 2008 % of NA-ACCORD participants among the unadjusted estimate of PLWH-US in all 50 states and DC at the end of 2008 was 3.1% (26,030/831,578)