Download
1 / 19
190 likes | 208 Views
This research presents a new experimental approach for complete and intensity-calibrated spectra analysis without quantum mechanical assignment. It discusses the strengths, weaknesses, challenges, and relation to the usual quantum mechanical modeling approach. Preliminary results are presented to illustrate the potential of this approach.

E N D
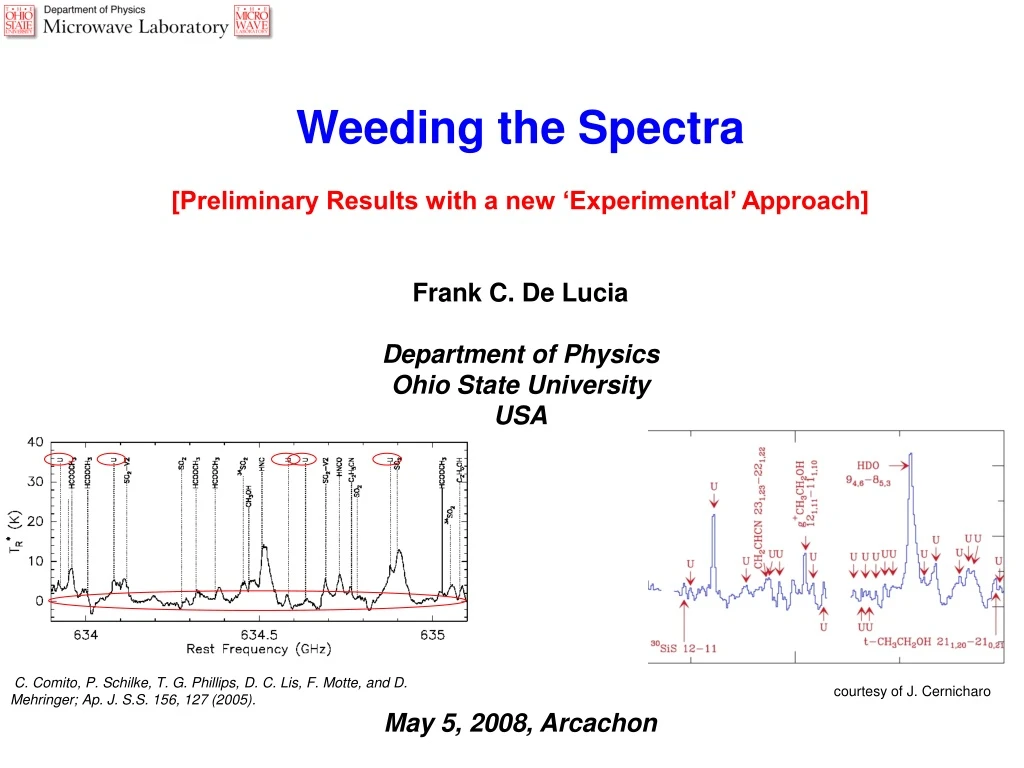
Weeding the Spectra [Preliminary Results with a new ‘Experimental’ Approach] Frank C. De Lucia Department of Physics Ohio State University USA May 5, 2008, Arcachon C. Comito, P. Schilke, T. G. Phillips, D. C. Lis, F. Motte, and D. Mehringer; Ap. J. S.S. 156, 127 (2005). courtesy of J. Cernicharo
The Discussion Today 1. Meetings for ‘spectroscopy in support of ‘X’ are becoming popular 2. The spectroscopists’ dirty little secret: We measure, assign, and model what we can - not what you need - the catalogues are massively incomplete. 3. We have proposed an alternative: Use of fast recording of complete, intensity calibrated spectra as a function of temperature – without quantum mechanical assignment - to provide the usual astrophysical catalogues. 4. Today: Preliminary results (project is < 5 days old) to illustrate and use as a case study of the strengths, weaknesses, challenges, and symbiotic relation to the usual quantum mechanical modeling approach.
Background AN EXPERIMENTAL APPROACH TO THE PREDICTION OF COMPLETE MILLIMETER AND SUBMILLIMETER SPECTRA AT ASTROPHYSICAL TEMPERATURES: APPLICATIONS TO CONFUSION-LIMITED ASTROPHYSICAL OBSERVATIONS, Ivan R. Medvedev and Frank C. De Lucia, The Astrophysical Journal 656, 621-628 (2007)
The Fundamental Problem: A Brief History of Bootstrap Astrophysical Spectroscopy and Models In the beginning there were only a few astrophysical lines: H2CO, NH3, CO, . . . Laboratory mm/submm spectroscopy was ahead of the astronomy Then there were U-lines - exotic species like HCO+ Astrophysical reality made it easy in the lab - astronomers got use to complete catalogues: Small Molecules: Astrophysically abundant and spectroscopically strong (good partition function) Easy to characterize from lab studies: ‘simple’ models were ‘complete’ - generate ‘complete’ catalogues But then along came methanol, methyl formate, and others: Spectral complexity is a very steep function of molecular size The difficulty of complete spectroscopic modeling is also a very steep function of molecular size It is not possible to over emphasize this last point about molecular size
The Nature of the Challenge The problem is not that there are so many lines (QM models are very good at calculating lots of spectral frequencies), but rather: 1. These lines come from many different low lying vibrational/torsional states. 2. Each of these states is a new assignment problem 3. The difficulty of these problems can increase very rapidly with energy a. Approach barrier heights b. Perturbations and mixings among states We have worked on this problem for > 50 years with model based approaches With existing telescopes: Examples for which large fractions of lines are unknown Herschel and ALMA dramatically expand frequency and sensitivity limits
The Nature of a Solution What do we need/want? We Need Complete Spectra at Arbitrary Temperature/Excitation Maintain the catalog format for the interface between spectroscopists and astronomers How can we get it? Quantum Mechanical Models are the backbone of what we do But, now in laboratory we can record rapidly complete spectra at selected T By recording spectra at multiple (at least two) temperatures 1. the usual catalog of transition strength and lower state energy can be calculated for all of the lines of the complete spectra, and 2. the spectra at an arbitrary/astrophysical temperature can be calculated What do we need to worry about? Where are we?
FAst Scan Submillimeter Spectroscopic Technique (FASSST) spectrometer Magnet Mylar beam splitter 1 Glass rings used to suppress reflections Lens Reference gas cell InSb detector 1 BWO Lens Aluminum cell: length 6 m; diameter 15 cm Length ~60 cm Path of microwave radiation Frequency roll-off preamplifier Mylar beam splitter 2 Reference channel InSb detector 2 Preamplifier Interference fringes Spectrum Signal channel Stepper motor Data acquisition system Computer Ring cavity: L~15 m Stainless steel rails Slow wave structure sweeper Trigger channel /Triangular waveform channel Filament voltage power supply High voltage power supply
The Classical Weed: Methyl Formate < 0.01 sec
FASSST Gives us Complete Two Dimensional Spectroscopy 1000 such spectra expanded to visible resolution extend to Paris Variable Temperature Leads to Third Dimension
The Calculation of Line Frequencies and Lower State Energies from Unassigned Experimental Data An Example of the Formalism
Ratio of Assigned and Unassigned Lines to Provide Lower State Energy Unassigned Line (1) Divide: Assigned Line (2) C1
An Example of the Energy Plot 1. Ramp Temperature from -50 C to 150 C @ ~0.50/min 2. Measure Spectrum every 15 Seconds (~800 Spectra at ~ 30 MBytes/spectra) 3. If everything is stable, easy to understand (normalize to line strength of assigned reference line), straight line in log (1/T) space Collisional Cooling: 1 K - 300 K Systematic Ripples Scatter Astronomical Temperatures? Temperature Calibration?
Three Dimensional Spectroscopy gives back to Assignment Spectroscopy
Lower State Energy vs. Thermal Behavior 600 cm-1 0 cm-1 163 163.5 164 GHz
A Symbiotic Relation ‘Experimental’ 3-D Spectroscopy depends heavily on Quantum Mechanical Assignment Spectroscopy ‘Experimental’ 3-D Spectroscopy is a very advantageous data base for Quantum Mechanical Assignment Spectroscopy Intensity calibrated Known lower state energies Large amounts of complete data Useful even before best/final analysis for astronomy We will archive these data in a public place They represent much more data than we can analyze
Analysis Strategies Preliminary Demonstration – Shake out of Approach Single assigned line chosen for reference Temperatures from thermocouples Intensities from peak finder Production Scheme – A Grand Fit Typically hundreds of assigned lines available for reference/statistical calibration Temperatures from intensity fit of hundreds of assigned lines Intensities from spectral analysis (linewidth issues)
Accuracy - What are the Challenges? Scatter - Amplitude from Peak Finder – can improve by at least an order of magnitude Reflections/baseline ripple – no suppression – order of magnitude? plus? Limited Temperature Range – Have used Collisional Cooling with temperature calibration to below 2 K Temperature calibration - Will do from known spectra, not thermometers Use a Grand Fit for reference, not a single line Of 3-D Spectroscopy Parameters Of the Astronomical Parameters – Propagation of Error: Astronomical Intensities should have error similar to the measured laboratory errors if the lab measurements include the astronomical temperature region.
Model Integration for Accuracy and Surety Combined Model - Grand Fit Quantum Model Experimental Model Line Frequencies Calculated Measured some lines all lines, interpolated all vibrational states extrapolated redundant model accuracy? Intensities Calculated Measured some lines all lines redundant, model accuracy? 1. Standard output (frequencies, transition moments and lower state energies) for catalogues 2. Redundant QM model guards against blunders in direct measurement (from errors to impurities) 3. Measurement of all lines eliminates errors in extrapolated frequencies (especially for model challenged species) 4. Quantum Mechanical intensities provide cross check on reliability and accuracy of experimental intensities 5. Experimental intensities provide cross check for model errors in the QM models of complex spectra
The Relationships Among Spectroscopy, Catalogues, and Astrophysics have Changed Dramatically: We Need a New Strategy From experimental measurements at two temperatures T1 and T2, it is possible to calculate spectrum (with intensities) at an arbitrary T3. For low T3, a relatively low T2improves the accuracy of the calculated spectrum. Collisional cooling provides a general method for achieving this low T2 FASSST is a means of obtaining the needed data rapidly and with chemical concentrations constant over the data collection period. It is realistic in a finite time to produce catalogs complete enough to account even for the quasi-continua that sets the confusion limit. In the limit of ‘complete’ spectroscopic knowledge, the confusion limit will probably be set by the unknowns associated with the complexity of the astrophysical conditions, but the high spatial resolution of large telescopes and modern arrays may reduce this complexity. The 3-D spectroscopic data will be archived. The quantum mechanical method and the ‘experimental’ method are symbiotic Needed so that progress can be cumulative