Download
1 / 44
460 likes | 650 Views
LEARNING OBJECTIVES . Describe the main roles of a treasury department and the key concerns of managers when dealing with working capital Comment on the factors influencing the balance of the different types of debt in terms of maturity, currency and interest rates

E N D
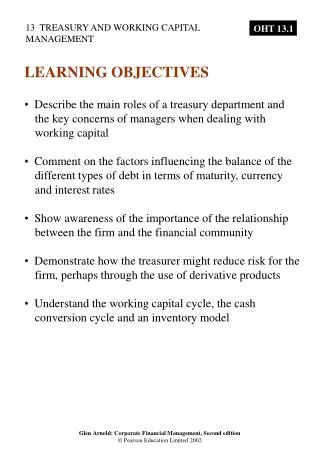
LEARNING OBJECTIVES • Describe the main roles of a treasury department and • the key concerns of managers when dealing with • working capital • Comment on the factors influencing the balance of the • different types of debt in terms of maturity, currency • and interest rates • Show awareness of the importance of the relationship • between the firm and the financial community • Demonstrate how the treasurer might reduce risk for the • firm, perhaps through the use of derivative products • Understand the working capital cycle, the cash • conversion cycle and an inventory model
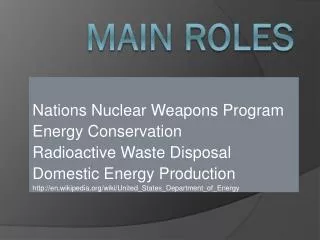
The difference between current assets and current liabilities Net current assets (net current liabilities) Working capital encompasses: Short-term resources Inventory Debtors Investments Cash Less Short-term liabilities trade creditors short-term borrowing other creditors payable within a year WORKING CAPITAL
Exhibit 13.1 The main areas of treasury and working capital management Key considerations Aspects Financing How much to borrow? T ype of finance. Balance of finance. Advice, e.g. merger financing, gearing. CASH FLOW Relationships with the financial community: – Shareholder relationships; – Number of banks; – Relationships versus transactional banking. Risk management T reasury and Business risk. working capital Insurable. management Currency risk. Interest rate risk. W orking capital and liquidity management W orking capital cycle. Cash management. RISK Investment of temporary surplus cash. Inventory management. Creditor management. Debtor management.
Borrowing long or short? To match or not to match? Currency of borrowing? Interest rate type? Retained earnings as a financing option? Strategic considerations Advice (e.g. merger financing, gearing) Relationships with the financial community Treasurer and financing decisions
Is it better to borrow long or short? Short-term debt Medium-term debt Long-term debt Considerations Maturity structure Cost of issue/arrangement Flexibility The uncertainty of getting future finance The term structure of interest rates
£m Exhibit 13.3: An example of a company conscious of the necessity for a range of maturity dates for debt – Thames Water plc Gross debt maturity profile 200 150 £m 100 50 0 1996 2000 2005 2010 and beyond
Interest rate Exhibit 13.5 A shifting yield curve affects the relative cost of long- and short-term borrowing – the example of Rosa plc The yield curve at time 1 (one year after the initial loan) 10% 8.3% The yield curve at time zero 8% Interest rate 7% 1 4 5 Years to maturity
Exhibit 13.6 Moderate financing policy stance – the matching principle Short-term finance £ Long-term finance (debt and equity) T ime Fixed Permanent Fluctuating assets current current assets assets
Exhibit 13.7 An aggressive financing policy Short-term finance £ Long-term finance (debt and equity) T ime Fixed Permanent Fluctuating assets current current assets assets
Exhibit 13.8 A conservative financing policy A vailable for investment in short-term financial instruments Long-term finance £ (debt and equity) T ime Fixed Permanent Fluctuating assets current current assets assets
RETAINED EARNINGS AS A FINANCING OPTION • Advantages • No dilution of the existing shareholders’ share of corporate control or share of returns • Retaining earnings avoids the issuing costs • Management do not have to explain in such detail the use to which the funds will be put(a dubious advantage for shareholders) • Disadvantages • Limited by the firm’s profits • Using retained earnings means reducing the dividend payout • Uncertain as fluctuate with the company’s fortunes • Many managers regard them as essentially ‘free capital’
Planned, sustained effort to maintain mutual understanding between shareholders and company Banking relationships Multiple banks Transaction banking vs. relationship banking Relationships with the financial community
RISK MANAGEMENT Three reasons firms sacrifice some potential profits in order to reduce the impact of adverse events: 1 It helps financial planning 2 Reduces the fear of financial distress 3 Some risks are not rewarded
TYPES OF RISK • Business risk • Insurable risk • Currency risk • Interest-rate risk
WORKING CAPITAL MANAGEMENT W ork-in-progress Raw materials Finished goods stock Operation costs: Labour , overheads marketing, distribution, etc. Sale T rade creditors T rade debtors Cash Shareholders T axation Long-term debt Fixed assets Medium-term finance: leases, HP The working capital cycle Other cash flows Exhibit 13.10 A typical working capital cycle and other cash flows
CASH-CONVERSION CYCLE Stock-conversion period Raw material W ork-in-progress Finished goods Debtor conversion stock period period inventory period period Credit period granted by Cash conversion cycle suppliers Input Creditor Production Production Output Debtor purchased paid starts completed sold pays Exhibit 13.11 The cash-conversion cycle as part of the working capital cycle Exhibit 13.12 Summary of cash-conversion cycle Cash- Stock- Debtor - Credit period = + – conversion conversion conversion granted by cycle period period suppliers
Raw materials stock period The average number of days raw materials remain • unchanged and in stock: Raw materials Average value of raw materials stock stock period Average purchase of raw materials per day = X days = • Less • Average credit period granted by suppliers The average length of time between the • purchase of inputs and payment of them: Average level of creditors Purchases on credit per day Credit period = = X days • Add • Work-in-progress period The number of days to convert raw materials into • finished goods: Work-in-progress period Average value of work-in-progress Average cost of goods sold per day = = X days • Add • Finished goods inventory period The number of days finished goods await delivery to • customers: Finished goods inventory period Average value of finished goods in stock Average cost of goods sold per day = = X days • Add • Debtor-conversion period The average number of days to convert customer debts into • cash: Debtor conversion period Average value of debtors Average value of sales per day = = X days Exhibit 13.13 Calculation of cash-conversion cycle
20X1 20X2 Mean Per day Exhibit 13.14 Figures invented in order to calculate a cash-conversion cycle The cash-conversion cycle is the length of time a pound is tied up in current assets. For the figures given in Exhibit 13.14 it is: Raw materials stock period = 23,000,000 295,890 = 78 days Less creditor period* = 13,000,000 295,890 = – 44 days Work-in-progress period = 10,500,000 378,082 = 28 days Finished goods inventory period = 9,500,000 378,082 = 25 days Debtor-conversion period = 31,000,000 438,356 = 71 days Cash conversion cycle = 158 days *Note: This is simplified to the creditor period on a single input, raw materials – there will be other inputs and creditors in most firms £m £m £m £000s Raw materials inventory 22 24 23 Cr editors 12 14 13 W ork-in-pr ogr ess inventory 10 11 10.5 Finished goods inventory 9 10 9.5 Debtors 30 32 31 Sales 150 170 160 438,356 Raw material pur chases (annual) 100 116 108 295,890 Cost of goods sold (annual) 130 146 138 378,082
Exhibit 13.16 Working capital tension Shortage costs Carrying costs Loss of production Costs of tying up and sales due to too versus funds. Storage, little working capital. handling and Loss of customer ordering costs. goodwill. Liquidity risk
THE DYNAMICS OF WORKING CAPITAL Stock-conversion period (raw material + work-in-pr ogr ess + finished goods periods) 2 months Debtor conversion period 1.5 months Cr editor period 1 month Assuming that the input costs are 60 per cent of sales the working capital investment will be £1,750,000: Stock 60% ´ £10m ´ 2/12 1,000,000 Debtors £10m ´ 1.5/12 1,250,000 Cr editors 60% ´ £10m ´ 1/12 –500,000 £1,750,000 Exhibit 13.17 Working capital periods
1.250 1.125 2.0 £m 0.25 14% = = months /12 month £15m ´1/2 /12 = –0.375 1/2 1/12 1/2 1 1/2 ease to 1 month ´ ´ Possibility 3 ease to 1 ease to £15m £15m ´ ´ Decr Decr Decr 60% 60% 107% 3.625 1.875 2.25 2.50 £m –1.125 = = = months /12 1/2 2/12 3/12 1/2 ease to 3 months ease to 2 months 1 Possibility 2 ´ ´ ´ ease to 1 £15m £15m £15m Incr Incr Incr ´ ´ 60% 60% Exhibit 13.18 Working capital changes when sales rise by 50 per cent WORKING CAPITAL POLICIES 50% 1.875 2.625 0.875 £m 1.5 –0.750 = = = months /12 1/2 2/12 1/12 1/2 1 Possibility 1 Constant @ 2 months ´ ´ ´ Constant @ 1 month Constant @ 1 £15m £15m £15m ´ ´ 60% 60% Conversion periods Percentage increase over £1.75m orking capital Absolute increase investment Creditors Debtors Creditors Debtors Stock Stock W
orking capital £ W Exhibit 13.19 Policies for working capital Relaxed 25 Moderate 20 Aggressive 15 Working capital £ 10 5 20 40 60 80 Sales £ Note: The numbers are illustrative and do not imply a ‘normal’ relationship between sales and current assets.
OVERTRADING • Overtrading occurs when a business has insufficient finance for working capital to sustain its level of trading. • Bits and Rams Ltd • 1999: Turnover of £2m and a profit of £200,000. • £000 • Turnover 2,000 • Cost of goods sold 1,800 • Profit 200 • All costs are variable • Debtors generally take two and a half months to pay • Inventories are for two months’ worth of cost sales • Trade creditors are paid one and a half months after • delivery • In 2000 sales doubled • Turnover 4,000 • Cost of goods sold 3,600 • Profit +400 • Additional investment in debtors (2,000 ´ 21/2/12) –417 • Additional investment in inventories (1,800 ´ 2/12) –300 • Tax bill from previous year’s trading –67 • Increase in trade creditors (1,800 ´ 11/2/12) +225 • Cash flow –159 • Exhibit 13.20 Cash flow for Bits and Rams Ltd £000
WHY IS CASH SO IMPORTANT? 1 Transaction motive 2 Precautionary motive 3 Speculative motive
Costs of holding too little cash Cost of holding cash • Annoyance of those to whom • payment is due if payments are • not made on time. Could lead to • reluctance to supply. Can • eventually lead to liquidation. • Loss of interest. • Inability to cope with emergencies, • e.g. competitor’s action, fire, • strikes, bad weather. . • Opportunities missed, e.g. contracts, • buying another business. versus • Loss of discounts from suppliers by • not having cash to pay early. • Higher cost of borrowing • because unexpected cash needs • have to be met from temporary • borrowing rather than drawing • on cash balances. • Loss of purchasing • power – inflation erodes the • value of cash. • Credit rating might fall because of • low current and acid test ratios. • Regular payments have to be made • to top up the cash balances, e.g. • transaction cost of selling • securities to release cash and • arrangement fees for overdrafts. Exhibit: 13.21 The cash trade-off
Cash balance £80,000 Maximum Q A verage cash balance £40,000 1 2 3 4 5 6 7 8 9 10 11 W eek Exhibit 13.22 Cash balances for Cypressa plc with Baumol’s model assumptions BAUMOL’S CASH MODEL • Cash used at a constant rate • Pays out £100,000 per week • Receives a steady inflow of £80,000 per week • Need for additional cash of £20,000 per week • Beginning cash balance of £80,000 • Arrangement fees on £80,000 of borrowing or the transaction costs of selling £80,000 of Treasury bills are £500.
Q A ´ ´ + K C 2 Q 2CA K Cost of cash balance £ Combined cost of holding cash Cost of cash balance £ Opportunity cost of cash T ransaction costs Optimum (maximum) Cash balance (maximum, Q) cash balance, Q* Exhibit 13.23 Finding the optimum cash balance The following factors to help establish the position of Q mathematically: Q = maximum cash balance Q/2 = average cash balance C = transaction costs for selling securities or arranging a loan A = total amount of new cash needed for the period under consideration; this is usually one year K = the holding cost of cash (the opportunity cost equal to the rate of return forgone) The total cost line consists of the following: Average amount tied up ´ Opportunity cost + Number of transactions ´ Cost of each transaction The optimal cash balance Q is found as follows: Q* =
Assume the interest rate K is 7 per cent. The annual need for cash is (£20,000 ´ 52) = £1,040,000. The optimal amount to transfer into cash on each occasion is: Cypressa should replenish its cash balances to the extent of £121,890. The number of times replenishment will take place each year: A/Q* = £1,040,000/£121,890 = between eight and nine times a year. 2 ´ £500 ´ £1,040,000 Q* = = £121,890 0.07
Cash £ SOME CONSIDERATIONS FOR CASH MANAGEMENT • Create a policy framework • Plan cash flows • Exhibit 13.24 Cash planning Cash surplus Cash inflow Constant cash outflows Cash £ Jan Feb Mar Apr May June July Aug Sep Oct Nov Dec
Sales £000s T otal Paid for in month Paid for 1 month of deliver y later August 90 30 60 September 90 30 60 October 120 40 80 November 150 50 100 December 600 200 400 Januar y 60 20 40 Exhibit 13.25 Cedrus plc: sales
£000s Aug Sep Oct Nov Dec Jan Cash inflows S ales (delivered and paid for in same month) 30 30 40 50 200 20 Sales (cash r eceived fr om prior month’ s sales) 60 60 60 80 100 400 T otal inflows 90 90 100 130 300 420 Cash outflows Payments for materials 50 50 55 55 55 55 W ages 20 20 22 25 30 22 Rent 10 10 10 10 10 10 Other expenses 10 10 11 9 10 11 New machine 100 Adver tising 50 T ax 150 T otal outflows 90 90 198 149 105 248 Balances Opening cash balance for month 50 50 50 (48) (67) 128 Net cash surplus (deficit) for month – 0 0 (98) (19) 195 172 inflows minus outflows Closing cash balance 50 50 (48) (67) 128 300 Exhibit 13.26 Cedrus plc cash budget
CONTROL CASH FLOWS • Set in place a co-ordinating system to ensure • that funds are transferred from where there • is surplus to where they are needed • Funnel money to the centre • Cash flow synchronisation • Cash budget • Delays in the cheque-clearing system • The float
Exhibit 13.27 The delays in clearing a cheque Customer writes cheque and sends it by post. 1–2 days Supplier receives cheque. 1 day Supplier pays in cheque at bank. 2–4 days Cheque is cleared through bank clearing system – supplier’s account is credited, customer’s account is debited.
INVENTORY MANAGEMENT Exhibit 13.28 The inventory trade-off If low inventory levels If high inventory levels then risk is: then: High ordering cost Cost of tying up cash Cost of ‘stock-outs’ (lost interest) – loss of sales Storage costs – loss of profits Management costs versus – loss of goodwill Obsolescence – production dislocation Deterioration Insurance costs Protection (e.g. security patrols)
INVENTORY MANAGEMENT MODELLING IN A WORLD OF UNCERTAINTY Exhibit 13.29 Stock levels over time in a predictable environment Maximum inventory Q A verage inventory Q/2 Zero inventory T ime
Costs £ or HQ 2 Combined costs Costs £ Holding costs Ordering costs Economic order quantity Order quantity (units) • Exhibit 13.30 Optimum inventory cost • C is the cost of placing each order • A is the annual usage of the inventory items • H is the cost of holding one unit of stock for one year • The annual ordering costs = Number of orders per year ´ Cost of each order • = A/Q´C or AC Q and: The cost of holding stock = A verage stock level (in units) Cost of holding ´ each unit = Q/2 ´ H The total cost is: AC HQ + Q 2 If this total cost equation is dif fer entiated with r espect to EOQ and the derivative is set equal to zer o the EOQ which gives the lowest total cost will be: 2 AC EOQ = H
Inventory (units) Exhibit 13.31 Inventory level pattern where there is a delay between order and delivery 8,000 Reordering at 2,000 units in weeks 3 and 7 for delivery in weeks 4 and 8 Inventory (units) 2,000 1 2 3 4 5 6 7 8 9 W eeks
Inventory (units) Exhibit 13.32 Inventory level pattern when there is uncertainty over the lead time 1st period 2nd period 3rd period 4th period 10,000 8,000 Inventory (units) 4,000 Reorder level 2,000 1 2 3 4 5 6 7 8 9 10 11 12 13 14 Lead time Lead time Lead time W eeks
Exhibit 13.33 The credit trade-off Costs of not taking trade credit Costs of accepting trade credit If trade credit is not taken • Passing up of lower alternative sources of finance may prices/discounts. have to be used, which may be costly . Loss of reputation/goodwill if versus late payment is pushed too far. . Paying all bills on delivery may involve more administration Administration costs of expense than paying through a managing of trade creditor delayed account system. records and making payments.
INVESTMENT OF TEMPORARY SURPLUS FUNDS • Short-term cash surpluses arise for a number of reasons: • Seasonal or cyclical business • To meet large outflow events • A firm may have sold an asset or raised fresh • borrowing but have yet to direct that money • to its final use • Surprisingly good control of working capital
Exhibit 13.34 The short-term investment trade-off Liquidity risk Default risk versus Maximising Event risk return V aluation risk Inflation risk
INVESTMENT POLICY 1 Defining the investable funds 2 Acceptable investment 3 Limits on holdings
Exhibit 13.36 Some of the investments available to a corporate treasurer ‘Sight’ deposit at a bank, e.g. current account Instant withdrawal – highly liquid but low interest rate. Some notice is required to withdraw funds. Time deposit at a bank Interbank lending: (a) Sterling (b) Foreign currencies Banks and others borrow and lend to each other. Certificate of deposit (CD) A company agrees to lock away a sum (e.g. £500,000) in a bank deposit for a period of between three months and five years. The bank provides the company with a certificate of deposit stating that the bank will pay interest and the original capital to the holder. This is now a valuable instrument and the company can sell this to release cash. The buyer of the CD will receive the deposited money on maturity plus interest. Result: the bank has money deposited for a set period and the original lender can obtain cash by selling the CD at any time. Treasury bills Sold by the government at a discount to face value to provide an effective yield. Tradeable in the secondary market. Bank bills (acceptance credits) See Chapter 12 A bill of exchange accepted by a bank. The bank is committed to pay the amount on the bill at maturity. A company with surplus cash could invest in such a bill. Local authority deposits Lending to a local authority (local government). Discount market deposits A deposit normally repayable at call (on demand) or made for very short term with a London discount house. Gilts Purchase of UK government bonds, usually in the secondary market. Corporate bonds Secondary-market purchases of bonds issued by other firms. Eurobonds, FRN, EMTN Lending on an international bond – see Chapter 11. Commercial paper Unsecured promissory note: usually 60 days or less to maturity. Shares See Chapters 9 and 10. Derivatives (futures, swaps, options, etc.) See Chapter 21.