Download
1 / 23
230 likes | 244 Views
China’s Economic Performance and Prospects. Nicholas Hope Castilleja High School April 17, 2006. China’s Economic Performance and Prospects. 1.1 – 1.8 Background 2.1 – 2.3 Dimensions of the Economy 3.1 – 3.3 Poverty in China 4.1 – 4.4 China in the Global Economy

E N D
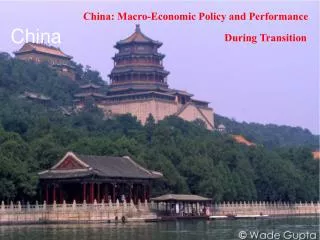
China’s Economic Performance and Prospects Nicholas Hope Castilleja High School April 17, 2006
China’s Economic Performance and Prospects 1.1 – 1.8 Background 2.1 – 2.3 Dimensions of the Economy 3.1 – 3.3 Poverty in China 4.1 – 4.4 China in the Global Economy 5.1 – 5.3 China’s 11th Five-Year Plan
1.3 Some Background Why should we care and teach about China? • A fifth of humanity (1,296 of 6,345 million people in 2004 according to WDI 2005) • A fascinating history and culture with a written language that extends back 5,000 years • A growing economic power; fast growth since 1978 could portend China’s resumption of its position as the world’s largest economy (as it was until the 1700s) • A potential challenge to U.S. superiority, with evident implications for international security, global cooperation • A future filled with potential but also unresolved challenges Background
1.4 Chinese Dynasties • Prehistoric Xia: 2000-1500 BCE • Zhou: 770-221 BCE • Longest dynasty in China • Doctrine of the mandate of heaven • Qin: 221-206 BCE • Shi Huangdi (First Emperor) • China unified Background
1.5 Chinese Dynasties • Han: 206 BCE – 220 CE • Confucian ideals of government • Sima Qian’s The Legalist Polices of the Qin, Selections from The Recordsof the Grand Historian • Invention of paper and porcelain • Period of North-South Disunion: 220-589 CE • Northern Wei: 386-535 CE • Capital at Loyang • Spread of Buddhism Background
1.6 Chinese Dynasties • Sui: 589-618 CE • China unified again • Grand Canal extended north from Hangzhou across the Yangzi to Yangzhou and then northwest to the region of Loyang • Tang: 618-907 CE • Capital moved to Chang’an • Silk Road • Golden Age of literature and art • Northern Song: 960-1125 CE • Southern Song: 1127-1279 CE • Centralized bureaucracy staffed with civilian scholar-officials • Rise of mercantile class Background
1.7 Chinese Dynasties • Yuan (Mongols): 1279-1368 CE • Founded by Kublai Khan, grandson of Genghis Khan • Excessive spending and trade restriction severely depleted China economically • Ming: 1368-1644 CE • Capital moved to Beijing • Revival of strict agrarian-centered society • Naval capabilities far ahead of rest of the world (1421); later abandoned - By 1700, China was rich on a global scale • Qing: 1644 – 1911 CE • For the second time China was ruled by foreigners, the Manchu • Time of peace and prosperity during the reigns of the first three rulers • Commerce and international trade grew • 1800s colonial takeovers Background
1.8 Chinese Dynasties • Republic of China established in 1911 by Dr. Sun Yet-San • 1920-30s – “warlordism”, economic disruption, invasion by Japan • 1945-49 Civil War – Mao and the CCP; Nationalists to Taiwan • 1948-78: • Communist wrongheadedness • “Great Leap Forward”: 20 million starved (see Jasper Becker, Hungry Ghosts: Mao’s Secret Famine) • “Cultural Revolution”: destruction of the ‘olds’. Many books: Life and Death in Shanghai by Nien Cheng • 1978 – now: Deng Xiao Peng, reforms Background
2.1 Dimensions of the Economy • At the end of 2004, China was: • The world’s most populous country (1,296 million) • (2. India - 1,080; 3. USA - 294; 4. Indonesia - 218; 5. Brazil - 179) • The fourth largest in area (9.6 million sq. km) • (1. Russian Federation - 17.1; 2. Canada - 10.0; 3. USA - 9.6; • 5. Brazil - 8.5) • The sixth largest economy in gross national income (GNI – • $1.66 trillion) • (1. USA – 11.7; 2. Japan – 4.7; 3. Germany – 2.7; 4. UK – 2.2; • 5. France – 2.0; 7. Italy – 1.65) • The second largest economy in PPP GNI ($7.2 trillion) • (1. USA – 11.7; 3. Japan – 3.8; 4. India – 3.3; 5. Germany – 2.3) • Only 132nd in terms of per capita GNI ($1,290); compare with India ($620 – 159th); Japan ($37,180 – 9th); USA ($41,400 – 5th); • Norway ($52,030 – 2nd) Dimensions
2.2 Dimensions of the Economy Sources: World Development Indicators 2005, World Bank and National Bureau of Statistics of China 2006 revision of historical data Notes: Only values for 1995 on reflect historical revisions. 2005 values are author’s estimates. Dimensions
2.3 Effects on People’s Lives Sources: World Development Indicators 2004, World Bank; illiteracy rates from Globalis-China Dimensions
3.1 Poverty in China • China’s GDP per capita was approximately $1,710 in 2005. It was $604 in 1995. • China has done well in reducing poverty but using international comparisons there is still much to do • China’s Poor (from World Bank: WDI 2005) • % of Chinese living on: • 1999 2001 • $1 a day or less (PPP $) 17.8 16.6 • $2 a day or less (PPP $) 50.1 46.7 • If China continues to grow as projected, poverty will be reduced greatly by 2015 Poverty
3.2 Poverty in China • How is poverty measured? for international comparisons, need standardized approach based on purchasing power parity of domestic currency in terms of dollars (the numeraire) • China’s internal definition of poverty is more austere: • about 61 cents in 1985 PPP dollars (c.f. $1 internationally) • By China’s own measurements, in 1993 80 million remained poor in rural areas • The 8-7 program was introduced to eliminate rural poverty in 7 years. It was: • under funded • misdirected in some respects (too much hardware; insufficient software) • successful to a degree (GOC reported only 40 million poor in rural areas by 2000) Poverty
3.3 Poverty in China • Meanwhile, urban poverty (which was present, but disregarded) became a pressing issue. What were the causes? • recognition of the condition (elderly; infirm) • the fall-out from the “floating population,” 100 million plus former agricultural workers seeking work in the cities • the end of the “iron rice bowl.” Government and state-owned enterprises began to rationalize work forces; people became unemployed • By end-2003, the State Council Leading Group for Poverty Alleviation and Development recognized a remaining 29 million rural poor; resettlement increasingly seen as the solution • By end-2003, urban poverty (measured by welfare assistance to reach a minimum subsistence level) was 17.63 million • As in every country, poverty will continue to bedevil Chinese policy makers Poverty
4.1 China in the Global Economy • Rapid growth in East Asia has been attributed to: • high savings rates • emphasis on education • export orientation – promoting competitiveness and economic efficiency • (see The East Asian Miracle, World Bank 1993, Oxford • University Press, New York) • But other things were important too: stability of the macroeconomy, • openness to new ideas, market prices (that reflect, and are • determined by, economic forces) • During its reforms, China has adopted the same model. After • largely closing itself off from the world in the 1950s, its international • engagement has burgeoned since 1978 (see table on next slide) Global Economy
4.2 China’s Engagement with the World • Sources: World Development Indicators, World Bank, and International Financial Statistics, International Monetary Fund • Exports and imports of goods and services respectively, (BOP, current US$), from WDI database • Foreign-exchange reserves minus gold, from IMF IFS database • Net direct investment in reporting economy (nie), from IMF IFS database. Chinese data are higher ($52.7 billion in 2002) • Period average exchange rates, from IMF IFS database • Author’s estimates Global Economy
4.3 China in the Global Economy • In 2005, the sum of China’s exports and imports of goods and services • was 63% of GDP (it was 44% in 2000; 29% in 1990) • By this same measure, China is the third largest trading power • (1. USA; 2. Germany) • By end-2005, China’s foreign exchange reserves reached $ 819 billion • For the past decade, China has been far and away the largest • recipient of FDI amongst developing countries; in many years being • second only to the US amongst all countries • Over two decades the composition of China’s merchandise • trade has changed radically Global Economy
4.4 China in the Global Economy • Some of the issues associated with China’s rapid emergence as a global trading power are: • China’s bilateral trade imbalances, especially the large trade surplus with the US • China’s seemingly overwhelming competitive advantage in labor intensive manufactures. Is China taking over the global markets for textiles, garments, toys, • less-sophisticated consumer electronics? • Related to this, does • China’s cost advantage in many products depend on “sweat shops” or even prison labor? • Is China’s low-wage labor depressing blue-collar wages worldwide? • How will the promises made for WTO accession affect China’s trade volumes and patterns? Will China become more open to imports, especially of services, agricultural products, automobiles and other high-end consumer durables? • And more recently, how much should China appreciate its currency? Global Economy
5.1 China’s 11th Five-Year Plan After 25 years of rapid growth (9% a year on average) Chinese officials now concerned about the quality of growth as well. Growth in 2006--10 should average 7.5-8.0%; its pattern should be: • Less resource-intensive (implying less stressful on the environment) • More “knowledge-driven” (i.e. efficient) • Better balanced (meaning less divergence in growth between West and East, and rural and urban)
5.2 China’s 11th Five-Year Plan To do this requires faster growth in sectors that require less capital, energy and other resources but generate more jobs. Priorities are (from the World Bank): • More financial sector reform • Better corporate governance • A dividend policy for state-owned firms • A greater role for private firms • Fewer restrictions on service industries and labor mobility
5.3 China’s 11th Five-Year Plan Building a “harmonious,” “well-off” society also requires public finance measures: • To raise government spending on education, health, and social protection (especially in rural areas) • To tax energy and other resource use to align private and social costs (objective: reduce energy intensity of GDP by 20%)