Download
1 / 7
70 likes | 88 Views
Learn how to solve equations graphically using the Y2=0 method. Follow steps to find x-intercepts and confirm solutions using the TABLE feature.

E N D
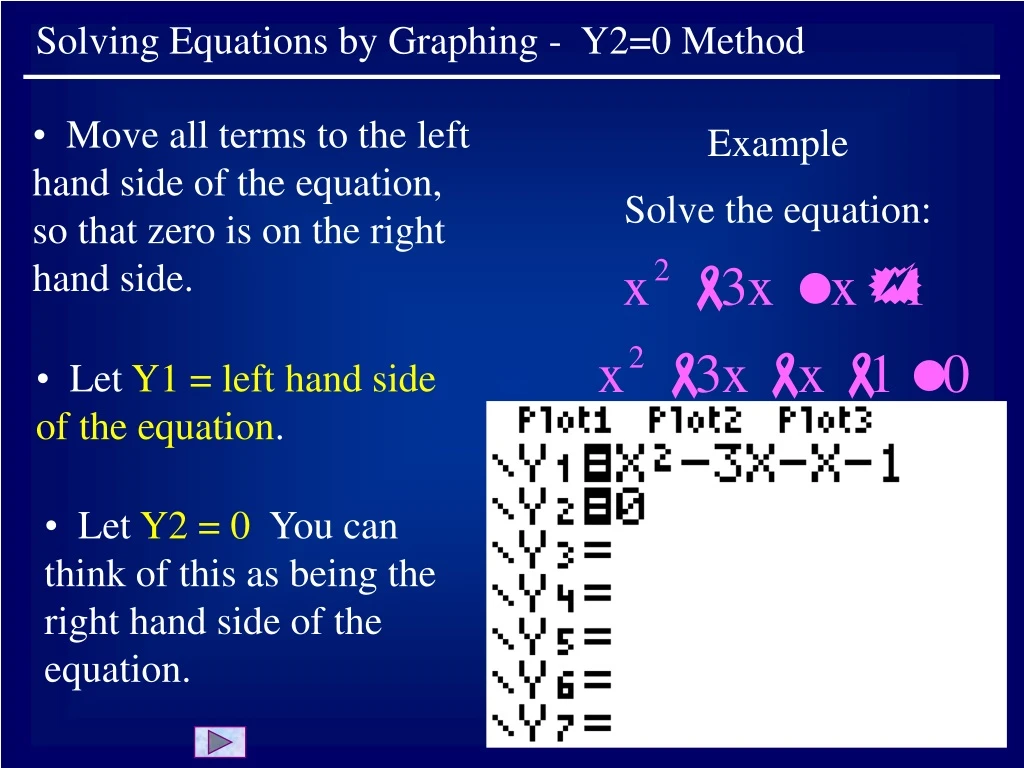
Example Solve the equation: Solving Equations by Graphing - Y2=0 Method • Move all terms to the left hand side of the equation, so that zero is on the right hand side. • Let Y1 = left hand side of the equation. • Let Y2 = 0 You can think of this as being the right hand side of the equation.
Example Solve the equation: Solving Equations by Graphing - Y2=0 Method • Find a suitable graph window that shows where the graph intersects the x-axis. In this case ZOOM|ZStandard is sufficient. • We now want to find the x-intercepts. These are the points (x,0) where, for a given value of x, the y-value is zero, or Y1 = 0. Slide 2
Example Solve the equation: Solving Equations by Graphing - Y2=0 Method • Recall that Y2=0 is a horizontal line, which is actually the x-axis … • Since the line is the x-axis, it is “hidden”, and its not obvious looking at the calculator screen that we have actually drawn two curves on the graph. Slide 3
Example Solve the equation: Solving Equations by Graphing - Y2=0 Method • Use CALC|intersect (explained in an earlier module) to find the intersection points of the curve and the line. Note that these points are also the x-intercepts of the curve • The point on the left is approximately (- 0.24, 0). • The point on the right is approximately (4.24, 0) Slide 4
Solving Equations by Graphing - Y2=0 Method • Approximate solutions to the equation are x = - 0.24, 4.24. • To confirm that these are correct solutions, use TABLE. • TBLSET, Ask • TABLE • Enter the two x-values in the x-column and notice that the values in the Y1 column are approximately zero, as they should be. Slide 5
Example Solve the equation: Solving Equations by Graphing - Y2=0 Method • The solutions just found were to the equation • Note that these are the same x-values that satisfy the original equation Slide 6