Download
1 / 76
790 likes | 831 Views
Explore the dynamics of global oil markets, pricing mechanisms, refining processes, and petroleum trade. Gain insights into crude oil markers, pricing fluctuations, refining margins, and refining capacity. Understand the impact of petroleum stocks on prices and the role of OPEC in stabilizing oil markets. Stay informed about crude oil value, trade paths, and refined product applications. Enhance your knowledge of key concepts in the petroleum industry with this detailed analysis.

E N D
Topics 1- Oil Markets 2- Crude Oil Pricing 3- Refining 4- Refined Products Prices (Asia/AG) 5- LPG 6- Shipping
Oil Markets • Crude Oil Markers (Benchmarks) • World Refining Centers • Oil Movement & Trade Paths • Petroleum Trade Markets • Petroleum Stocks
Crude Oil Markers The Three Main Crude Oil Markers are: • West Texas Intermediate - America • Brent - Europe & Africa • Dubai - Asia/Pacific
NWE MED US ASIA WORLD REFINING CENTERS
BRENT WTI DUBAI OIL MOVEMENT & TRADE PATHS
Arbitrage • The Trade Between Geographical Areas to Earn Profit • The Arbitrage is Open When the Price in the Loading Port Plus Freight is Less Than the Price at the Discharge Port
Arbitrage Demand
$21/MT $14/MT $14 /MT $30 /MT Naphtha Arbitrage (Japan/MED) $228/MT $177/MT $200/MT “THE ARB IS OPEN” MAR ‘97
– $5/MT $7/MT $13 /MT $29 /MT Naphtha Arbitrage (Japan/MED) $200/MT $177/MT $176/MT $180/MT “THE ARB IS CLOSE” SEP ‘97
Petroleum Stocks Reports American Petroleum Institute (API) • Weekly Report Covering the US Energy Information Agency (EIA/DOE) • Weekly Report Covering the US - Official International Energy Agency (IEA) • Monthly Report Covering OECD
API Report August 6, 1999
Stocks’ Impact On Prices $/BBL 1,000 BBL 18 400,000 16 14 350,000 12 10 300,000 8 6 250,000 4 2 0 200,000 5-Oct 7-Sep 3-Aug 27-Jul 14-Sep 21-Sep 28-Sep 12-Oct 19-Oct 26-Oct 10-Aug 17-Aug 24-Aug 31-Aug US Total Crude Stocks (API) WTI Cushing Mth1
Topics 1- Oil Markets 2- Crude Oil Market 3- Refining 4- Refined Products Prices (Asia/AG) 5- LPG 6- Shipping
Crude Oil Market • Evolution of Crude Oil Pricing • Crude Oil Value • Petroleum Oil Price Reporting • Crude Oil Contracts • Crude Oil Supply & Demand
Evolution of Crude Pricing • Posted Price: • Set by Governments of Producing Countries • Price Changes Infrequently & Varies by Producer • Netback Price: • Based on Product Prices Less Refining Fee • Guaranteed Refiners a Positive Margin • Market-Related Price: • Related to Published Quotation of a Marker Crude • Differentials Applied are Standard • Refining Margins are not Protected
Crude Oil Value Crude Oil Value is Related to the Value of the Refined Products • API • Sulfur Content Other Factors • Refinery Type (Configuration) • Paraffinic/Naphthenic
Oil Price Reporting • Who Report Oil Prices? • Platt’s • Petroleum Argus • London Oil Reports (ICIS-LOR)
Oil Price Reporting • How are Oil Prices Published? • Published Quotations Represent Fixed-Price Spot Transactions, Confirmed Bids & Offers and Market Talk. • Price Reporting Agencies have Different Bases for Trade Reporting, Freight Assessment and Freight Calculation
Contracts • Contract Types: • Term • Spot • Sales Types: • FOB Free On Board • CIF Cargo, Insurance & Freight • C&F Cargo & Freight • Others Lightering, ex-ship, ex-storage, …
Saudi Arabia Production: 8.3 MBD Consumption: 1.8 MBD Export: 6.5 MBD Far East: 48% Europe: 25% US 22% Others 5% 2000 Data
Saudi Arabia's 5-Year Crude Production Plan
Saudi Arabia's 5-Year Crude Production Plan (by Grade)
Top 10 Oil Production -2002 TOTAL WORLD: 73.94 Million BBL/Day
Organization of the Petroleum Exporting Countries (OPEC) • Founded in Baghdad in 1960 • Objective: To Coordinate and Unify Policies Among the Members in Order to Secure Fair and Stable Prices for Petroleum Producers OPEC COUNTRIES: IRAN, IRAQ, KUWAIT, SAUDI ARABIA, VENEZUELA, QATAR, INDONESIA, LIBYA, UAE, ALGERIA, & NIGERIA
TOPICS 1- Oil Markets 2- Crude Oil Pricing 3- Refining 4- Refined Products Prices (Asia/AG) 5- LPG 6- Shipping
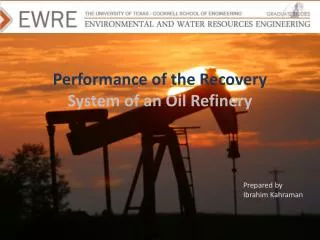
REFINING • Refined Products Supply/Demand • World Refining Capacity • Refined Products Applications • Refined Products Specifications • Regional Quality Variations Refined Products supply/demand figures are based on Purvin & Gertz report (March 2001 update) World refining capacity date are based on BPAmoco Statistical Review - 1999
World Supply & DemandRefined Products Deficit Surplus Thousand BBL/Day
World Supply & DemandRefined Products by Region Net Importer Net Exporter Thousand BBL/Day
Refined Products Applications • Propane: Petrochemical Industry/Home • Butane: Petrochemical/Home/Gasoline • Naphtha: Petrochemical/Gasoline • Jet: Jet Fuel/Domestic Appliances • Gasoil: Automotive Fuel/Heating Oil • Fuel Oil: Bunker/Power/Industrial Boilers
Products Specifications • Naphtha • Naphthenic / Paraffinic • Gasoline • Octane Number (RON/MON) • Sulfur Content / Olefins Content • Gasoil • Sulfur Content • Cetane Number • Fuel Oil • Sulfur Content • Viscosity • Straight-Run vs. Cracked
Regional Quality Variations • End Use Requirement • Climate Conditions • Refinery Technology • Environmental Issues • Environmental Issues
Regional Quality Variations • Gasoline • Lead-Free • MTBE Concern • Benzene Content • Volatility • Diesel • 0.05% Sulfur • Fuel Oil • 1.0% Sulfur NORTH AMERICA
Regional Quality Variations • Gasoline • Lead-Free • Benzene Content • Following the US • Diesel • 0.05% Sulfur • Fuel Oil • 1.0% Sulfur WESTERN EUROPE