Download
1 / 9
90 likes | 111 Views
Learn how to estimate the best fitting line for linear regression. Understand the properties of regression coefficients, sum of squared errors, correlation coefficient, and more. Explore how increasing sample size impacts parameter estimation accuracy, variance in observed values, and the significance of the signal-to-noise ratio. Discover the importance of intercept and error independence.

E N D
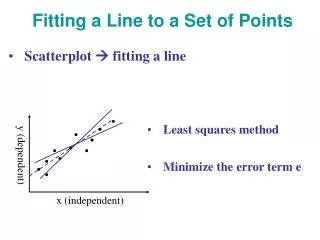
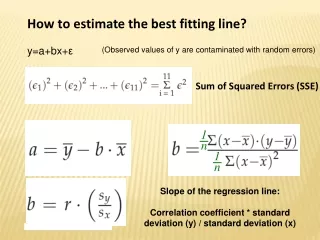
1 n 1 n How to estimate the best fitting line? y=a+bx+ε (Observed values of y are contaminated with random errors) Sum of Squared Errors (SSE) Slope of the regression line: Correlation coefficient * standard deviation (y) / standard deviation (x)
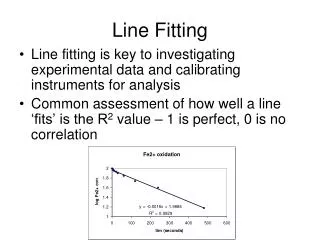
Properties of the estimated regression coefficients (1) With increasing sample size the estimated values become closer to the true parameter values of the linear function that relates y with x. (2) The variance of the observed y-values is the sum of the vaiance ‘explained by the linear model’ and the independent error variance (3) The correlation coefficient increases as the ratio between explained variance and error variance (signal–to–noise) increases
Estimate for the regression parameter: To distinguish the true (but unknown) parameters a, b from the estimated parameters, the ‘hat’ symbol is often used. The linear regression estimation problem revisited
Estimate for the regression parameter: Here the overbars denote the mean of the samples, sx and sy are the standard deviations of the samples of x and y Slope The linear regression estimation problem revisited In the next slides I assume that the data are centered and thus the mean of x and y are 0 (and the intercept is of secondary importance and one can set the intercept to 0) Intercept
Estimate for the regression parameter: Slope The linear regression estimation problem revisited
The linear regression estimation problem revisited Error independent of x => Covariance 0 O
The total variance is the sum of the variance explained by x plus the independent error variance ) The linear regression estimation problem revisited
The total variance is the sum of the variance explained by x plus the independent error variance The linear regression estimation problem revisited