Advances in Minority Game Theories and Market Dynamics: A Comprehensive Overview
This document presents a detailed overview of the research conducted from 2006-2007 by a group of scholars focusing on minority game theories and their implications in market dynamics. It includes various studies that analyze Nash equilibria, statistical mechanics of social choice, and agent-based models. Notable contributions include investigations into trend-following versus contrarian behavior, the impact of risk sensitivity among agents, and the exploration of non-Gaussian distributions in stock market behaviors. The research combines theoretical models with empirical data, advancing our understanding of economic behavior in complex systems.

Advances in Minority Game Theories and Market Dynamics: A Comprehensive Overview
E N D
Presentation Transcript
Overview 2006-2007 A. De Martino, I. Giardina, E. Marinari, I. Perez Castillo, A. Tedeschi, M. Virasoro
Laureati/Laureandi • Riccardo Di Clemente (Laurea triennale, fin. 2/2006) : on Nash equilibria of Minority Games (A. De Martino, M.A. Virasoro) • Luca Columbu (Laurea, fin. 12/2006) : on statistical mechanics of social choice and the Condorcet `paradox' (A. De Martino, E. Marinari) • Ottaviano Rosi (Laurea, fin. 4/2007) : on agent-based models of resource-sharing networks (A. De Martino, M.A. Virasoro) • Nicola Tamburrino (Laurea, exp. 2/2008) : on activity-volatility correlation in NYSE stocks (A. Tedeschi, M. Nicodemi)
Generalized Minority Games with risk-sensitive agents • Contrarians/trend-followers are described by minority/majority game players (rewarded when acting in the minority/majority group). • Our model allows to switch from one group to the other, according to the risk perceived by the agents. • Trend-following behavior dominates when price movements are small, whereas traders turn to a contrarian conduct when the market is chaotic. • De Martino, Giardina, Tedeschi, Marsili (2004) • De Martino, Giardina, Tedeschi (2004) • Tedeschi, De Martino, Giardina (2005) • Alfi, De Martino, Pietronero, Tedeschi (2006)
The payoff function is : N.B. ( ) is a tool to interpolate between two market regimes: agents change their conduct at some threshold value ( ).
Non-Gaussian distribution of Returns Excess Demands Time Series
Case of Endogenous Information • In this case trend-following behavior is expected to strongly influence the macroscopic properties, because of the bias that trends would impose on the resulting history dynamics.
Effective Potential Model & Mixed Min-Maj Game RW + linear force (attractive or repulsive): That force must be the gradiente of a quadratic potential (as in real data)
Effective Potential Model & Mixed Min-Maj Game Trascurando l’effetto della liquidita’, si ha che l’incremento di prezzo e’ proprio dato da: Un agente che basa le sue previsioni sulla ipotesi di linearita’, avra’ che il suo valore atteso dell’incremento di prezzo sara’ dato da: Cio’ vuol dire che gli agenti danno un peso maggiore ai cambiamenti di peso piu’ recenti. Tali agenti hanno un comportamento assai piu’ ricco di semplici agenti minority o majority, che quindi si puo’ ben descrivere con i nostri modelli ‘misti’.
Grand Canonical Minority Game • N traders (i=1,...,N) • P information patterns • Random strategies • Dynamics: • Active/inactive agents • where • (speculators and producers) The original model Risk averse Risk prone • - Challet, Marsili (2002) • Challet, De Martino, Marsili (2004) • Challet, De Martino, Marsili, Perez Castillo (2006)
Problems • Dependence on the initial conditions (non-ergodic regime). • Sample-to-sample dependence. • Finite-size effects.
GCMG with finite score memory The payoff becomes Agents Memory is time steps.
Reproducing Stylized Facts • The dipendence on initial condition is removed. • The disorder-sample dependence is removed. • For = 0.001 stylized facts are generated.
Multi-asset Minority Game • Model with many assets: The role of risk in choosing the asset: complex market structure. - Bianconi, De Martino, Ferreira, Marsili (2006) • Model with different information sources. Can agent detect meaningful signals? - De Martino, Tedeschi, Virasoro (in preparation)
Waiting times between orders and trades • The data have been extracted from the ‘order book’ of the LSE. • Our data set includes waiting times between orders and trades for both Glaxo Smith Kline and Vodafone stocks traded in the months of March, June, and October 2002. • Nearly 800,000 orders and 540,000 trades have been analyzed. Both limit and market orders have been included. • For orders and trades of each stock, the average waiting times and the standard deviations are given in Table below. The difference between these two values already points to a non-exponential distribution of durations. • Scalas, Kaizoji, Kirchler, Huber, Tedeschi (2006)
Statistical Equilibrium in Economics • Scalas, Gallegati, Guerci, Mas, Tedeschi (2006) • Gallegati, Scalas and Tedeschi (in preparation)
We analyze real data about firm size, in order to validate simple money-exchange models and other ABM. We study the AIDA database, containing all data concerning Italian firms from 1996 to 2003. We concentrate on the quantities more relevant for our analysis, i.e. quantities that are directly related to the firm growth: the capital K, the added value VA, the worker number L and the asset A. More precisely, we examine the distribution of each of the above indicators and the associated Boltzmann function H, defined as Where for the theoretical quantities we consider: with and
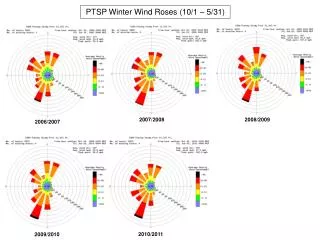
Linear Dependency between volatility and activity We consider high frequency data of the New York Stock Exchange, in particular the trades extracted from the TAQ database. The dataset contains a record of every transaction that took place during the period January 1995 – December 2003. In order to get rid of the effect of opening and closing auctions, we analyze just the transactions occurred between 9.30 am and 15.58 pm. We limit our analysis to stocks with more than 6000 daily transactions, and in particular to the 30 DJIA stocks. We divide every trading day in T time intervals of the same length, such that a sufficient trade number is present in each of them. We evaluate standard deviation of log – returns (volatility) and trade number (activity) in each interval. We average over the whole month (20 trading days). Thus, we have T volatility values and T activity values for each month, over which we can compute correlations and perform the hypothesis tests. The above analysis was repeated for different time intervals, different fluctuation evaluating criteria, and different hypothesis tests. -Tedeschi, Scalas, Nicodemi, Di Matteo, Aste (in preparation)
Activity, volatility and Absolute fluctuations vs. time, and scatter-plot of activity and volatility Istogramma dei valori delle correlazioni significative (circa 70% del totale)