Download
1 / 35
350 likes | 640 Views
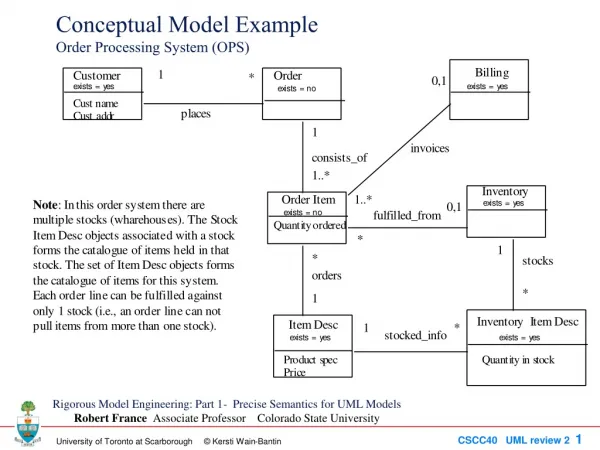
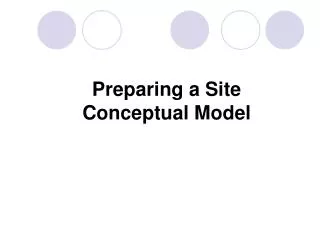
EXAMPLE Constructing Conceptual Site Model (CSM) Diagrams using the Simulation Editor. FRAMES-2.0 Workshop U.S. Nuclear Regulatory Commission Bethesda, Maryland November 15-16, 2007 Pacific Northwest National Laboratory Richland, Washington. Introduction.

E N D
EXAMPLEConstructing ConceptualSite Model (CSM) Diagrams using the Simulation Editor FRAMES-2.0 Workshop U.S. Nuclear Regulatory Commission Bethesda, Maryland November 15-16, 2007 Pacific Northwest National Laboratory Richland, Washington
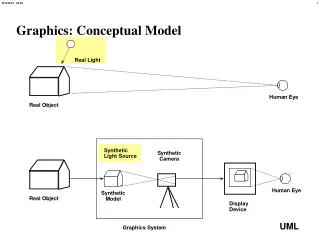
Introduction • The Simulation Editor allows the user to drawn schematic diagrams depicting the Conceptual Site Model (CSM). • The CSM is based on real-world icons depicting the flow path of the contaminant through from the release point, through various environmental media, to a receptor of concern. • The Simulation Editor design is based on sequential modeling. • Dynamic feedback (closed-loop) is handled within each module and is not a responsibility of the system. 2
Rules of Thumb for Building CSMs • You can build any picture you want, but the models may not be able to exist within the scheme you build. Build step-by-step. • Many analytical and semi-analytical transport models only accept a single input. • A plus operator will most likely be required to handle multiple inputs from the same icon type, assuming the same DICs are produced by the upstream models. • Many exposure models accept multiple inputs (e.g., inhalation, ingestion, dermal contact, external dose); therefore, they may allow multiple connections. • Intake and Health Impact modules usually accept single input. • Establish standardized CSMs, if the CSMs are to be used repeatedly. • Lock models and databases, if these represent acceptable tools. • Start simple, then build on a base situation 3
Start Simple (FRAMES -1.6 Example; sent by user) 4
Conceptual Site Model #1 Step 1: Contaminants leaches from a landfill to the subsurface. Contaminants move through three vadose zones, through an aquifer, to Well #1, where water is withdrawn to irrigate Agricultural area #1 to feed Population #1. 6
Conceptual Model #1 Step 2: Precipitation events cause overland runoff from the landfill, which has surface contamination. The overland runoff flows into a nearby river. Water is withdrawn from the river, where Population #1, related to Agricultural Area #1, consume the water (i.e., drinking water). 8
Conceptual Model #1 • Step 3: The wind blows across the top of the landfill causing suspension of contaminated particles into the air. Volatilization of organics into the air also occurs. The contaminants are transported through the air and contaminate a different Agricultural Area #2 through wet and dry deposition. This area is used to help feed Population #1. 10
Conceptual Model #1 • Step 4: In addition to producing crops that are consumed by Population #1, Agricultural area #2 also produces crops that are consumed by Population #2. 12
Conceptual Site Model #2 Pittsburgh is surrounded by three rivers (Monongahela, Allegheny, and Ohio). A known release, in violation of the an NPDES permit, discharges to the Monongahela. A landfill leaches the same contaminant to the Allegheny. Water is removed from both waterways to supply potable water to the same population in the city. What is the risk to the population from these two sources? Assume that the exposure module accepts only one input (i.e., same DIC). 15
CSM #2 16
Conceptual Model #3 Step 1: There is a known discharge that contaminates an aquifer. The contamination moves through the aquifer to where water is withdrawn and used to irrigate Agricultural area #1. Crops are consumed by Population #1. 18
Conceptual Model #3 Step 2: The contamination in the aquifer proceeds by the withdrawal well and continues to a near by river. Contamination enters the river, and Population 1 is exposed through recreational activities (e.g., swimming, boating, fishing, etc.). 20
Conceptual Model #3 Step 3: There is a separate and known release of contaminates to the air, which is transported through the atmosphere to Agricultural Area #1, where Population 1 breathes the air. 22
Conceptual Model #3 Step 4: Water is withdrawn from the river, and Population #2 uses the water as its potable water supply. 24
Linking to the Sensitivity/Uncertainty Module Conceptual Site Model #4 26
Conceptual Model #4 Step 1: Build the following Conceptual Site Model: SourceVadose ZoneAquiferExposureIntakeRisk 27
Conceptual Model #4 Step 2: Analyze parameter uncertainty, based on a Monte Carlo analysis. Vary input Kd in the vadose zone and correlate it to the peak mass flux rate from the vadose zone: Input parameter to Vadose Zone Model: Kd Output parameter from Vadose Zone model: Peak Mass Flux Rate 29
Vary Vadose Zone Kd (input) on vadose zone flux (output) CSM #4: Step 2 30
Conceptual Model #4 Step 3: Analyze parameter uncertainty, based on a Monte Carlo analysis. Vary input Kd in the vadose zone, and correlated it to the peak aquifer concentration: Input parameter to Vadose Zone Model: Kd Output parameter from Aquifer: Peak Aquifer Concentration 31
Uncertainty of vadose zone input Kd (input) on aquifer concentrations (output) CSM #4: Step 3 32
Conceptual Model #4 Step 4: Analyze parameter uncertainty, based on a Monte Carlo analysis. Input parameters: Vary the source-term inventory Vary input Kd in the vadose zone Output parameters: Peak Concentration from Aquifer Module Peak Risk from Health Impacts Module 33
Summary • Schematic of the Conceptual Site Model • Based on real-world Icons • Easy to quickly describe and understand the CSM • Easy to convey the problem to stakeholders • Easy to archive for QA/QC • Easy to change • There are also ways in which two-stage Monte Carlo analyses can be performed but were not shown. 35