Download
1 / 38
420 likes | 965 Views
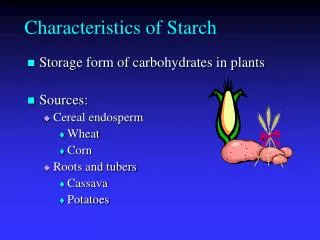
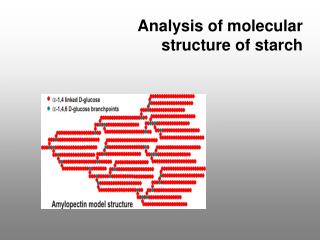
Analysis of molecular structure of starch. Physicochemical properties/ Chemical composition. Molecular structure. Genes. Biosynthesis (enzymes). Molecular Structure of Amylose. Molecular Structure of Amylopectin. Average chain-length and amount (mole %)

E N D
Physicochemical properties/ Chemical composition Molecular structure Genes Biosynthesis (enzymes)
Average chain-length and amount (mole %) • of the fractions of amylopectin unit chain
Number average degree of polymerization (molecular size, DP) Average chain length (CL) Amylose Average number of chain (NC) Linear amylose fraction (mole%) Branched amylose fraction (mole%) Molecular characterization
Molecular characterization Average (branch) chain length, overall Average (branch) chain length, of A-chain Amylopectin Average (branch) chain length, of B1-chain Average (branch) chain length, of B2-chain Unit chain (A, B1, B2, B3,..) fraction (mole%)
Methods of Analysis • Colorimetric methods • chemical reaction • chemical reaction + enzyme reaction • Chromatographic Techniques • without enzyme reaction • with enzyme reaction Low-angle laser-light-scattering photometer Refractive index detector Detector Pulsed amperometric detector Fluorescence detector
Average degree of polymerization = total sugar (molecular size, DP) reducing end sugar Average chain length (CL) = total sugar non-reducing end sugar Colorimetric methods (chemical reaction) Determine: Total sugar/ Reducing end/Non-reducing end Average number of chain (NC) = DP/CL
Reducing end sugar Modified Park-Johnson’s method Ref; 1. J. Park and M.J. Johnson, J. Biol. Chem., 181 (1949), 149-151. 2. S. Hizukuri, Y.Takeda, M. Yasuda, Carbohydrate Research, 94 (1981), 205-213. • Total sugar: • Anthrone-H2SO4 • Phenol-H2SO4 Non-reducing end sugar Rapid Smith Degradation method Ref; 1. J.K. Hamilton and F. Smith, J. Am. Chem. Soc., 78 (1956), 5907-5909. 2. S. Hizukuri and S. Osaki, Carbohydrate Research, 63 (1978), 261-264.
Branch chain length (CL) = total sugar non-reducing end sugar Colorimetric methods (chemical reaction + enzyme reaction) Isoamylase/pullulanase Hydrolyze -1,6 by isoamylase/pullulanase Determine reducing end sugar by Modified Park & Johnson’s method
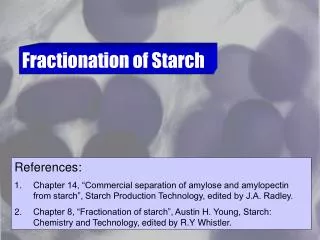
Experimental Procedure Chromatographic Techniques with Enzyme Reaction Amylopectin structure studied by HPSEC Starch Fractionation (selective precipitation) Amylose Amylopectin Molecular analyses (HPSEC) Debranched
Chromatographic Techniques with Enzyme Reaction Isoamylase or pullulanase. A B B A C A B A
Chromatographic Techniques with Enzyme Reaction Column Mobile Phase |S||M||L| Recorder Detectors Solvent Delivery System Injector Response L M S Injection of debranched amylopectin Retention time Chart record Figure 6Block diagram showing the component of an HPSEC instrument.
Experimental Procedure Amylopectin structure studied by HPSEC • Column: Zorbax PSM 60S ( 2) • MW range: 5 102 – 104 • Column dimension: 6.2 mm ID 250 mm • Loading size: 40 μl • Eluent: 90% DMSO • Flow rate: 0.5 ml/min • Pressure: <3,000 psi • Column temperature: 50oC • Standard: maltoheptaose, pullulan6000 and pullulan12000 (MW 1,170, 5,900, 11,800, respectively)
Results & Discussion MW 1,170, 17.845 min MW 11,800, 12.639 min MW 5,900, 13.727 min Figure 7High-performance size exclusion chromatography of maltoheptaose, pullulan6000 and pullulan12000.
Results & Discussion Pullulan12000 Pullulan6000 Maltoheptaose Log MW = -0.1867(Retention time; min) + 6.3882 R2 = 0.9906 Figure 8Standard curve for Zorbax PSM60S ( 2).
Results & Discussion Normal rice Waxy rice Waxy corn Normal corn Normal potato Waxy potato Figure 9High-performance size exclusion chromatography of isoamylolyzate of amylopectin from starches.
Results & Discussion Yuan et al. (1993) • Refractive index response is proportional to the mass of the eluted material. • The relative mole was derived by dividing the relative mass (RI response) by the corresponding molecular weight.
Results & Discussion Waxy rice Normal rice Normal corn Waxy corn Normal potato Waxy potato Figure 10High-performance size exclusion chromatography of isoamylolyzate of amylopectin from starches.
High performance anion-exchange chromatography with pulsed amperometric detection (HPAEC-PAD) System: Model 4000i Dionex BioLC system Column: Dionex HPIC-AS6 (now called CarboPac PA-1) 250 4 mm (10 µm) with AG6 guard column (50 4 mm) Detector: Model 2 PAD system Individual members of the components can be obtained • Ref: 1. Koizumi K. and Fukuda M., Estimation of the distributions of chain length of amylopectins by HPAEC-PAD, J. of Chromatography, 585 (1991), 233-238. • 2. Hanashiro, I., Abe, J., & Hizukuri, S. (1996). A periodic distribution of the chain length of amylopectin as revealed by high-performance anion-exchange chromatography. Carbohydrate Research, 283, 151-159.
Cannot determine the individual glucans directly by use of their peak areas in the chromatogram, as the responses of a pulsed amperometric detector to glucans having different DPs were different.
High performance size-exclusion chromatography (HPSEC) with fluorescence detector System: HPLC Column: For amylose TSK gel G6000PW, G4000PW and G3000PW (7.575 mm) (Tosoh Co., Tokyo, Japan), connected in series TSK guard column PWH (7.575 mm) Temp. 37 C, Eluent: 0.1 M phosphate buffer (pH 6.1) containing 0.02% sodium azide Detector: Fluorescence Detector Refractive index detector Fluorescent reagent: 2-aminopyridine (aromatic primary amine) Std. amylose: AS-110 (DP 521), AS-320 (2320), AS-1000 (4400) • Ref: Hanashiro, I., & Takeda, Y. (1998). Examination of number-average degree of polymerization and molar-based distribution of amylose by fluorescent labeling with 2-aminopyridine. Carbohydrate Research, 306, 421-426.
DPn = RI response (RI) fluorescence response (F)
Chromatograms of Fluorescence-labeled Amyloses DP Fluorescence RI DPsample = (RI/F)sample x DPstd. (RI/F)std.
Column for amylopectin (unit chain) Sample: Isoamylolyzate Column: Shodex OHpak SB-803HQ and SB-802.5HQ x 2 (8300 mm) Eluent: Aq. Me2SO (50%) containing 50 mM NaCl Column Temperature: 50 C Std. amylose: G6, AS-10 (52), AS-30 (141), AS-70 (440)
Beta-Amylolysis of Amylose Molecule Linear molecule Branch molecule Reducing end Glucose alpha-1,4 alpha-1,6 -amylolysis
Swelling of starch granule Increase viscosity of starch paste
6 5 Phosphorus 1 4 2 3