Download
1 / 24
240 likes | 338 Views
This study presents the Charge Transfer Efficiency correction for ACS observations, crucial for accurate photometry. The impact of CTE on flux measurements, its dependence on various factors, and methods for measuring and correcting for flux losses are discussed. The analysis procedure, formula derivation, and testing methodology are detailed for both HRC and WFC observations, including potential issues like background levels and cosmic rays. Time-dependent correction formulae are derived, providing improved accuracy for stellar flux measurements, along with suggestions for future work to enhance data analysis processes and refine formula application.

E N D
UPDATED CTE CORRECTION FORMULAE FOR ACS Marco Chiaberge Pey Lian Lim, Vera Kozhurina-Platais, Marco Sirianni Ron Gilliland, Jennifer Mack
CHARGE TRANFER EFFICIENCY (CTE) per pixel Defined as CTE = 1 - DQ/Q = 1 - CTI For an ideal CCD CTE = 1.0 For real CCDs CTE < 1 manufacturing imperfections in the crystalline lattice radiation damage (increasing with time) The total CTE is CTEN significant effect for large CCDs CTE depends on flux, sky level, # of transfers
The effect of CTE on stellar photometry is to reduce the measured flux (up to ~20% or more) A fraction of the “lost” flux goes into the “tail” But significant flux is just lost and cannot be recovered
Photometric test Allows to measure the total flux lost and provides correction formulae for photometry. Stars are positioned at different distance from the readout amplifier thus changing the number of transfers and therefore the impact of CTE. D C A C B A HRC D WFC
Observations Programs: CAL/ACS 9648, 10043, 10368 (PI:A. Riess), 10730 (PI: Chiab) FILTERS: F606W, F775W, F502N EXP TIMES: 30s, 360s for HRC; 30s and 400s for WFC (for HRC/F502N, 360s only) Post-flash used to achieve higher background levels F606W, LOW-FLASH, MED-FLASH, HIGH-FLASH Exp times: 30s, 360s No CR-REJECTION, no dithering 2 Observations/year (Cycle 11-13) Cycle 14 only 1 epoch (March 2006), no post-flash Cycle 15 1 test visit (Jul- Sept 2006) to test CR-SPLIT + dithering
POTENTIAL PROBLEMS Background levels Cycle 13, August 2005, HRC FLASH=0.5s FLASH=1s FLASH=3s
HOT PIXELS HRC, F606W, 30s 25”x25”
COSMIC RAYS WFC F606W, 400s 30”x30” CR are not uniformly distributed CRs and hot pixels may affect CTE estimates More important for low CTI, they increase the error
Published results before our new analysis WFC time dependent formula based on 3 epochs March 2003 – Feb 2004 Riess & Mack ISR 2004-006 HRC time dependent formula based on 1 epoch March 2003 Riess ISR 2003 – 009
ANALYSIS PROCEDURE • IRAF, SM, some IDL • Generate “clean”, deep, drz image using all data • Identify cosmic rays, hot pixels and saturated pixels and mark • them on DQ extension of FLT files • Mask out area around the saturated stars • Measure flux of “good” stars only on the single_sci files • Reject outliers (sigma clipping, 3 itearations) • Fit delta mag vs # of transfers for different bins of flux
Photometry Aperture photometry with “phot” (iraf. noao) R = 3 pixels Larger aperture radii return too few stars Background is measured in an annulus around each star (r = 15 d = 3)
WFC F775W - 30s March 2006 A linear fit is performed for each bin of flux (blue lines) Errors on the slope are estimated (yellow lines) Dmag = ax + b a = (7.9 ± 0.6) e-5 At y = 2000 this means a loss of 0.158 ± 0.015 mag
HRC F502N 360s Mar 2006
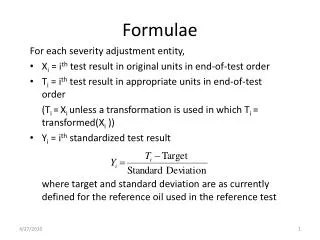
Results (Dmagy=2000) are collected for all bins of stellar flux and sky background at each epoch We assume a linear dependence with flux, sky, and # of transfers in agreement with other instruments and with internal CTE tests magy=2000 = 10A’ x SKY B x FLUX C For each epoch, the coefficients A’, B, C of the formula are determined by performing a multi-linear regression fit A’ IS TIME DEPENDENT We assume linear dependence on time and mag ~ 0 at t = 0 (launch) We use magy=0 = 0 mag = 10A x SKYB x FLUXC x Y/2000 x (MJD-52333)/365
The coefficients A, B, C are not time dependent and can be averaged between epochs Weighted means are calculated using 4 epochs (March 2003, March 2005, Aug 2005, March 2006) Typical errors on the coefficients (single epoch) ≤ 0.1 B is the coefficient with the largest spread among epochs (s = 0.06 WFC, s = 0.04 for HRC)
TESTING THE FORMULAE Apply the correction to data from different epochs, for different sky levels using the same data that were used to derive the formula Apply the correction to photometry performed with ePSF (both aperture photometry and PSF fitting) Compare prediction of the formula with measured mag losses at different epochs
F502N - 30s March 2005 F775W – 30s March 2005
ePSF photometry WFC F606W 30s vs 400s - March 2006 Aperture photometry PSF fitting
COMPARISON WITH PREVIOUS FORMULA SM4 ACS fail. Sky = 2e Flux = 650 Sky = 2e Flux = 2500e Sky = 2e Flux = 650
RESULTS and FUTURE WORK • Data from 4 epochs (March 2003 through March 2006) were analyzed using a new data analysis strategy aimed at obtaining “cleaner” results • We derived time-dependent correction formulae for both HRC and WFC that are accurate at the level of a few percent • New observations after SM4 using CR-REJ and possibly dithering • Procedures should be made automatic (or semi-automatic) • Formula for different aperture radii • Better data might lead to a better characterization Different form of the formula?