Download
1 / 33
330 likes | 345 Views
Studying the predictability of two intense Arctic cyclones in June 2018 using data sources and methods for evaluating forecast skill and influencing factors.

E N D
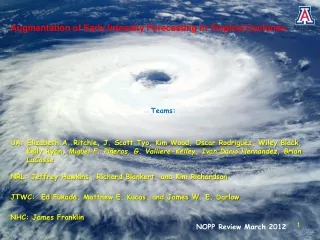
A Predictability Study of Two Intense Arctic Cyclones in Early June 2018 Daniel Keyser, Kevin A. Biernat, and Lance F. Bosart Department of Atmospheric and Environmental Sciences University at Albany, SUNY 15th AMS Conference on Polar Meteorology and Oceanography Monday 20 May 2019 Research Supported by ONR Grant N00014-18-1-2200
Motivation • Two unusually intense Arctic cyclones, AC1 and AC2, occurred in early June 2018 • Both AC1 and AC2 strengthen in a region of strong baroclinicity over western Eurasia ahead of respective high-amplitude upper-level troughs • AC1 and AC2 undergo a cyclonic rotation over the Arctic Ocean, during which AC1 is absorbed by AC2
Motivation Data source: ERA5 10 11 13 12 9 8 7 3 6 5 SLP (hPa) 4 4 3 6 5 2 AC1 AC2 Day in June 2018 labeled at 0000 UTC 0.5 1.5 2 σ -2 -1.5 -1 -0.5 0 1 Genesis 0000 UTC positions Lysis AC1 AC2 1–7 June 2018 time-mean 850-hPa temperature (°C, black) and standardized temperature anomalies (σ, shaded) Peak intensity of AC1 at 0400 UTC 4 June 2018 (968 hPa) Peak intensity of AC2 at 1100 UTC 7 June 2018 (962 hPa)
Motivation • Yamagami et al. (2018a,b) show that forecast skill for strong Arctic cyclones in summer can be low • Accurate forecasts of the Great Arctic Cyclone of August 2012 (AC12) extend only to 2–3 day lead time prior to peak intensity
Purpose • Evaluate the forecast skill of AC1 and AC2 • Diagnose factors that may influence the forecast skill of AC1 • Why focus on AC1? AC1 is absorbed by AC2, so that understanding the forecast skill of AC2 would require diagnosing factors that may influence the forecast skill of AC1
Data and Methods • Utilize 51-member ECMWF Ensemble Prediction System (EPS; Buizzaet al. 2007) from TIGGE (Bougeault et al. 2010) initialized 0–168 h prior to times of peak intensity of AC1 and AC2 in ERA5 (Hersbach and Dee 2016) • Utilize ERA5 as verification • Download ensemble and verification data at 0.5° horizontal resolution and 6-h temporal resolution
Data and Methods • Track AC1 and AC2 in ECMWF EPS and ERA5 utilizing an objective cyclone tracking algorithm based on sea level pressure (SLP) from Crawford and Serreze (2016)
Data and Methods • Determine cyclone intensity and position error based on value and position, respectively, of SLP minimum for forecasts valid at time of peak intensity in ERA5 • AC1: forecasts valid at 0000 UTC 4 June • AC2: forecasts valid at 1200 UTC 7 June • Calculate corresponding spread and rootmean square error (RMSE) of cyclone intensity and position for aforementioned forecasts
Intensity Error AC1: valid at 0000 UTC 4 Jun 2018 intensity error (hPa) forecast lead time (h) max 75% mean median intensity error = | min SLPEPS− min SLPERA5 | 25% min
Intensity Error AC1: valid at 0000 UTC 4 Jun 2018 AC2: valid at 1200 UTC 7 Jun 2018 intensity error (hPa) forecast lead time (h) max 75% mean median intensity error = | min SLPEPS− min SLPERA5 | 25% min
Position Error AC1: valid at 0000 UTC 4 Jun 2018 position error (km) forecast lead time (h) max 75% mean median position error = great circle distance between location of min SLPEPS and location of min SLPERA5 25% min
Position Error AC1: valid at 0000 UTC 4 Jun 2018 AC2: valid at 1200 UTC 7 Jun 2018 position error (km) forecast lead time (h) max 75% mean median position error = great circle distance between location of min SLPEPS and location of min SLPERA5 25% min
Intensity RMSE and Spread AC1: valid at 0000 UTC 4 Jun 2018 hPa forecast lead time (h) spread RMSE
Intensity RMSE and Spread AC1: valid at 0000 UTC 4 Jun 2018 AC2: valid at 1200 UTC 7 Jun 2018 hPa forecast lead time (h) spread RMSE
Position RMSE and Spread AC1: valid at 0000 UTC 4 Jun 2018 km forecast lead time (h) spread RMSE
Position RMSE and Spread AC1: valid at 0000 UTC 4 Jun 2018 AC2: valid at 1200 UTC 7 Jun 2018 km forecast lead time (h) spread RMSE
Diagnose Factors Influencing Forecast Skill of AC1 • Utilize ensemble forecasts initialized at 1200 UTC 30 May, which is 108h prior to time of peak intensity of AC1 in ERA5 (0000 UTC 4 Jun)
Diagnose Factors Influencing Forecast Skill of AC1 AC1: valid at 0000 UTC 4 Jun 2018 intensity hPa RMSE forecast lead time (h) spread AC1: valid at 0000 UTC 4 Jun 2018 position km forecast lead time (h)
Diagnose Factors Influencing Forecast Skill of AC1 • Separate ensemble members in terms of a metric adapted from Lamberson et al. (2016) that combines intensity and position error of AC1 • Subdivide members into two groups in terms of metric: one containing the 10 most accurate members and one containing the 10 least accurate members
108-h Forecast Position and Intensity of AC1 108-h forecast valid 0000 UTC 4 Jun 2018 SLP from ERA5 (hPa, contours); position of minimum SLP of AC1 [dots, colored by intensity (hPa) for ensembles] ERA5 (969) 965–970 970–975 980–985 975–980 985–990 990–995
108-h Forecast Position and Intensity of AC1 108-h forecast valid 0000 UTC 4 Jun 2018 SLP from ERA5 (hPa, contours); position of minimum SLP of AC1 [dots, colored by intensity (hPa) for ensembles] ERA5 (969) 965–970 970–975 980–985 975–980 985–990 990–995 most accurate group least accurate group
0000 UTC 2 June (60-h forecast) Synoptic Comparison Most Accurate Group Least Accurate Group PC PC AC1 AC1 (m s−1) (g kg−1) 4 4.5 5.5 6 7 8 5 90 50 70 30 40 60 80 100 Ensemble mean 300-hPa wind speed (m s−1, shaded), 1000–500-hPa thickness (dam, blue/red), SLP (hPa, black), and 925-hPa mixing ratio (g kg−1, shaded) for most and least accurate groups
1200 UTC 2 June (72-h forecast) Synoptic Comparison Most Accurate Group Least Accurate Group PC AC1 AC1 (m s−1) (g kg−1) 4 4.5 5.5 6 7 8 5 90 50 70 30 40 60 80 100 Ensemble mean 300-hPa wind speed (m s−1, shaded), 1000–500-hPa thickness (dam, blue/red), SLP (hPa, black), and 925-hPa mixing ratio (g kg−1, shaded) for most and least accurate groups
0000 UTC 3 June (84-h forecast) Synoptic Comparison Most Accurate Group Least Accurate Group AC1 AC1 (m s−1) (g kg−1) 4 4.5 5.5 6 7 8 5 90 50 70 30 40 60 80 100 Ensemble mean 300-hPa wind speed (m s−1, shaded), 1000–500-hPa thickness (dam, blue/red), SLP (hPa, black), and 925-hPa mixing ratio (g kg−1, shaded) for most and least accurate groups
1200 UTC 3 June (96-h forecast) Synoptic Comparison Most Accurate Group Least Accurate Group AC1 AC1 (m s−1) (g kg−1) 4 4.5 5.5 6 7 8 5 90 50 70 30 40 60 80 100 Ensemble mean 300-hPa wind speed (m s−1, shaded), 1000–500-hPa thickness (dam, blue/red), SLP (hPa, black), and 925-hPa mixing ratio (g kg−1, shaded) for most and least accurate groups
0000 UTC 4 June (108-h forecast) Synoptic Comparison Most Accurate Group Least Accurate Group AC1 AC1 (m s−1) (g kg−1) 4 4.5 5.5 6 7 8 5 90 50 70 30 40 60 80 100 Ensemble mean 300-hPa wind speed (m s−1, shaded), 1000–500-hPa thickness (dam, blue/red), SLP (hPa, black), and 925-hPa mixing ratio (g kg−1, shaded) for most and least accurate groups
Summary • Forecast skill of intensity in terms of RMSE for AC2 is much lower than that for AC1 • Intensity forecasts are strongly underdispersive for AC2 and slightly underdispersive for AC1 • Forecast skill of position in terms of RMSE for AC2 is higher than that for AC1 at 72–120-h lead time and lower than that for AC1 at other lead times • Position forecasts are somewhat underdispersive for AC2 and moderately underdispersive for AC1
Summary • Intensity forecasts for AC1 are less underdispersive than position forecasts for AC1 • Intensity forecasts for AC2 are more underdispersive than position forecasts for AC2
Summary • Comparison between most and least accurate groups for AC1 show a thermal trough is more amplified and a predecessor cyclone is weaker and positioned farther westward in most accurate group • Enables AC1 to intensify more and move farther northwestward in most accurate group
References • Bougeault, P., and Coauthors, 2010: The THORPEX Interactive Grand Global Ensemble. Bull. Amer. Meteor. Soc.,91, 1059–1072. • Buizza, R., J. R. Bidlot, N. Wedi, M. Fuentes, M. Hamrud, G. Holt, and F. Vitart, 2007: The new ECMWF VAREPS (Variable Resolution Ensemble Prediction System). Quart. J. Roy. Meteor. Soc.,133, 681–695. • Crawford, A., and M. Serreze, 2016: Does the summer Arctic frontal zone influence Arctic Ocean cyclone activity? J. Climate,29, 4977–4993. • Hersbach, H., and D. Dee, 2016: ERA5 reanalysis is in production. ECMWF Newsletter, No. 147 ECMWF, Reading, United Kingdom, 7. [Available online at www.ecmwf.int/sites/ default/files/elibrary/2016/16299-newsletter-no147- spring-2016.pdf.] • Lamberson, W. S., R. D. Torn, and L. F. Bosart, 2016: Diganosis of the source and evolution of medium-range forecast errors for Extratropical Cyclone Joachim. Wea. Forecasting,31, 1197–1214. • Yamagami, A., M. Matsueda, and H. L. Tanaka, 2018a: Predictability of the 2012 great Arctic cyclone on medium-range timescales. Polar Science,15, 13–23. • ——, ——, and ——, 2018b: Medium-range forecast skill for extraordinary Arctic cyclones in summer of 2008–2016.Geophys. Res. Lett.,45, 4429– 4437.
Diagnose Factors Influencing Forecast Skill of AC1 • Separate ensemble members in terms of a metric adapted from Lamberson et al. (2016) that combines intensity error and position error of AC1 • Rank members 1–51 for both intensity error and position error at time of peak intensity of AC1, with 1 corresponding to member with lowest error • Add intensity error rank to position error rank to determine a combined error rank • Subdivide members into two groups: one containing the 10 most accurate members and one containing the 10 least accurate members in terms of combined error rank
108-h Forecast Position and Intensity of AC1 108-h forecast valid 0000 UTC 4 Jun 2018 ERA5 (969) 965–970 970–975 Distribution of minimum SLP of AC1 (hPa) for most accurate group andleast accurate group 975–980 980–985 985–990 990–995 SLP from ERA5 (hPa, contours); position of minimum SLP of AC1 [dots, colored by intensity (hPa) for ensembles] ensemble group mean ERA5


![[June 2018]Avaya 7391X Study Guide Killtest](https://cdn4.slideserve.com/7918332/slide1-dt.jpg)