Download
1 / 22
220 likes | 351 Views
Intensity Analysis To Analyze Land Change. Robert Gilmore Pontius Jr Clark University, USA rpontius@clarku.edu Ten-minute primer for Intensity Analysis. Yan Gao National University of Mexico, Mexico yangao98@gmail.com

E N D
Intensity Analysis To Analyze Land Change Robert Gilmore Pontius Jr Clark University, USA rpontius@clarku.edu Ten-minute primer for Intensity Analysis. Yan Gao National University of Mexico, Mexico yangao98@gmail.com Design and interpretation of Intensity Analysis illustrated by land change in Kalimantan, Indonesia Grace Villamor University of Bonn, Germany gracev@uni-bonn.de Agroforest’sgrowing role in carbon losses from Jambi (Sumatra), Indonesia Michaela Buenemann New Mexico State University, USA elabuen@nmsu.edu Sensitivity of land change intensity observations to spatial resolution Robert Gilmore Pontius Jr Clark University, USA rpontius@clarku.edu Detection of important land transitions using Intensity Analysis
Ten-minute primer for Intensity Analysis Robert Gilmore Pontius Jr Clark University, USA rpontius@clarku.edu www.clarku.edu/~rpontius https://sites.google.com/site/intensityanalysis/
Intensity Analysis … • considers maps at T time points for the same set of J categories. • reads a transition matrix for each time interval. • computes changes at three levels: interval, category, and transition. • tests stationarity of changes across time intervals • has more than 200 citations of the seminal publication in 2004. • has software available for free at https://sites.google.com/site/intensityanalysis/. • will be taught in a workshop on Friday March 21 at 13:30-15:00 in Session 62 in room 0’119.
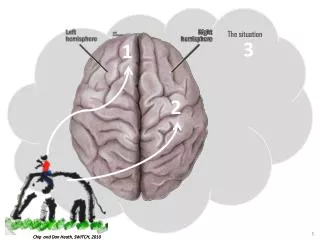
Plum Island Ecosystems (PIE) in USA Gil thinks you have this situation at your study area.
Each time interval has a transition matrix. Gil thinks you have this situation at your study area.
Purpose • Intensity Analysis reveals information from the set of T transition matrices to show changes compare relative to hypothetical uniform change. • Intensity Analysis shows three levels of information concerning whether each: • time interval is fast versus slow • category is active versus dormant in terms of gross loss and gross gain • transition is targeting versus avoiding other categories
Questions Answered • Interval level shows whether the amount of change is large simply because the duration of the interval is long. • Category level shows whether the loss or gain of a category is large simply because the category is large. • Transition level shows whether the transition is large simply because the sizes of the transitioning categories are large.
Three levels of Intensity Analysis • Interval level compares the annual change across time intervals. • Category level measures for each time interval: the size of each category’s loss relative to the size of the category at the interval’s initial time point, and the size of each category’s gain relative to the size of the category at the interval’s end time point. • Transition level measures for each transition in each time interval: the size of the transition’s gain relative to the size of the categories at the initial time point, and the size of the transition’s loss relative to the size of the categories at the end time point.
Get literature at www.clarku.edu/~rpontius • Aldwaik, Safaa and Robert Gilmore Pontius Jr. 2013. Map errors that could account for deviations from a uniform intensity of land change. International Journal of Geographical Information Science 27(9): 1717-1739. • Aldwaik, Safaa and Robert Gilmore Pontius Jr. 2012. Intensity analysis to unify measurements of size and stationarity of land changes by interval, category, and transition. Landscape and Urban Planning 106: 103-114. • Pontius Jr, Robert Gilmore, Emily Shusas and Menzie McEachern. 2004. Detecting important categorical land changes while accounting for persistence. Agriculture, Ecosystems & Environment 101(2-3): 251-268.
Criticism or Compliment One of the reviewers of Aldwaik and Pontius (2012) summarizes perfectly the most common reaction readers have to this method by writing “the analysis is so straightforward . . . any reasonable thinking scientist would come up with a similar approach to analysis and it should be obvious to most anyone that these analyses should be done. I would hope that to be the case. The proposed approach is just good, basic common sense bookkeeping of how to describe change.”
Detection of important land transitions using Intensity Analysis Aldwaik, Safaa and Robert Gilmore Pontius Jr. 2013. Map errors that could account for deviations from a uniform intensity of land change. International Journal of Geographical Information Science 27(9): 1717-1739.
Pontius wants you to … • Consider how suspected error in the data influences your interpretation of temporal change. • Visit www.clarku.edu/~rpontius to obtain manuscripts. • Visit https://sites.google.com/site/intensityanalysis/ to obtain a computer program to perform Intensity Analysis. • Attend the workshop on Friday March 21 at 13:30-15:00 in Session 62 in room 0’119.
Purpose of Method • We will never know the error in the data. • We can compute hypothetical error that could explain the patterns in the data. • We can compare the computed hypothetical error to the suspected error to tell whether a change is meaningfully different than uniform.
Interval Level Logic of Algorithm Category Level Transition Level
Time Interval Level Interval 1971-1985 appears slow, but perhaps the maps have errors that omit change in red. Intervals 1985-1991 and 1991-1999 appear fast, but perhaps the maps have errors that commit to more than the true amount of change in gray.
1991-1999 Category Level: Loss Built appears to be a dormant loser, but maybe this is because error of omission of Built at 1991 in red. Forest appears to be an active loser, but maybe this is because error of commission of forest at 1991 in gray.
1991-1999 Transition Level: To Built Built appears to avoid Forest, but maybe this is due to small Omission of Forest at 1991. Built appears to avoid Wet, but maybe this is due to large Omission of Wet at 1991. Built appears to avoid Other, but maybe this is due to Commission of Other at 1991.
1991-1999 Transition Level: To Built Are Builders really avoiding Forest? The intensity of the transition from Forest to Built is less than but close to the uniform intensity. Our method shows that 35 pixels of omission of Forest at 1991 can account for the deviation from uniform. The study area contains more than one million pixels.
Pontius wants you to … • Consider how suspected error in the data influences your interpretation of temporal change. • Visit www.clarku.edu/~rpontius to obtain manuscripts. • Visit https://sites.google.com/site/intensityanalysis/ to obtain a computer program to perform Intensity Analysis. • Attend the workshop on Friday March 21 at 13:30-15:00 in Session 62 in room 0’119.
1991-1999 Category Level: Gain Interpretation occurs here … .
1991-1999 Transition Level: From Forest Interpretation occurs here … .