Download
1 / 50
500 likes | 518 Views
This study explores the correlation between maternal BMI and levels of lipophilic persistent organic pollutants (L-POPs) in women of the MIREC Study. The objective is to determine if there is a relationship between maternal BMI and first trimester maternal serum levels of L-POPs.

E N D
Relationship Between BMI and L-POPs Levels in Women of the MIREC Study Presented by Marianne Levesque MD Candidate April 24, 2017
Outline • Background: • Maternal BMI and Congenital anomalies • L-POPs • Objective and Hypothesis • Methods • Results • Discussion
Maternal BMI and Congenital Anomalies • Associated with: • Neural tube defects; • Orofacial clefts; • Cardiovascular anomalies; • Anorectal atresia; • Limb reduction anomalies1. • Proposed mechanisms: • Undiagnosed GDM or hyperglycemia; • Nutritional deficiencies; • Lower U/S sensitivity2.
What are L-POPs? Lipophilic persistent organic pollutants are environmental chemicals with four important characteristics: • Extreme resistance to degradation; • Ability to spread across wide geographical areas (through soil, water, and air); • Tendency to accumulate in highest concentrations in adipose tissue; • Toxicity in living species3.
You May Know Them As… • Pesticides (e.g. DDT, aldrin, chlordane…) • Industrial chemicals (e.g. PCB, hexachlorobenzene…) And their by-products…
Importance • Humans are constantly exposed to them (mainly through diet)³. • Associated with endocrine disruption, dementia, cancer, and overall increased mortality4. • Has demonstrated transplacentaltransfer5,6. • Is known to interfere with normal growth and development in children7. • The link with maternal BMI has been poorly studied.
To determine whether there is a relationship between first trimester maternal BMI and first trimester maternal serum levels of L-POPs. Primary Objective: Secondary Objective: To determine if first trimester maternal weight loss is correlated with increased first trimester maternal serum levels of L-POPs.
Hypothesis • A negative relationship between maternal serum levels of L-POPs and maternal BMI. • Lowest levels being amongst overweight and obese women. • A negative relationship between maternal weight loss and maternal serum levels of L-POPs. • Women who lose weight will have increase L-POPs serum levels.
PotentialMechanism L-POP
The MIREC Study • A longitudinal national-level study. • Recruited 2001 pregnant women from 2008-2011. • 10 different clinical sites across Canada. • Purpose: «To examine potential adverse health effects of prenatal exposure to environmental chemicals on pregnancy and infant health.»8 • Outcome: A large data and specimens biobank made for future research.
Population • 1983 Women from the MIREC Study. • Inclusion criteria: • < 14 weeks of gestation; • >18 years old9. • Exclusions: • Fetal chromosomal anomalies, major fetal malformations or fetal abnormalities; • History of medical complications; • Illicit drug use; • Threatenedspontaneousabortion9. • Demographics: • Older; • Lesslikely to smoke; • Educated; • 36.6% overweight or obese9.
Data Assessed • First trimester maternal serum levels of 41 different L-POPS. • First trimester maternal anthropometric measurements. • Pre-pregnancy weight (self-reported). • Maternal serum lipid levels. • Maternalage.
Statistical Analysis Descriptive statistics – For all 41 L-POPs • Range (minimum and maximum levels) • Median • Interquartile range (quartile 3 and quartile 1) • Geometric mean and standard deviation
Statistical Analysis Relationship between BMI and [L-POPs] • First trimester BMI categories established using Health Canada’s BMI Nomogram classifications. • Unadjusted and adjusted (for maternal age and lipid levels) linear regression analysis of L-POPs levels with respects to BMI. • Pairwise comparisons of L-POPs levels (mean [95% CI]) between each BMI categories - using Tukey-Kramer adjustment (for each L-POP). • Significant p-value < 0.05
Statistical Analysis Relationship between weight variation and L-POPs serum levels Weightvariation = [Pre-pregnancyweight] – [First trimesterweight] • Assuming a linearrelationshipbetween the two variables, Pearson’scorrelationswereperformed. • Two groups thencreated for each BMI category: • Weightloss • Weight gain or weightneutral • Comparison of mean L-POPslevelsbetween the two groups for each BMI category.
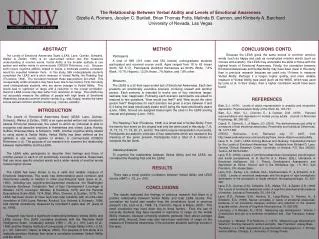
Findings Table 1. L-POPs distribution after adjusting for maternal age and serum lipid levels.
L-POPs Distribution • Testifies exposition to environmental toxins. • Most L-POPsunderlevel of detection (LOD)9. • Similar to L-POPs levels of women 20-39 years of age as established by the Canadian Health Measures Survey (CHMS) (Cycle 1, 2007–09)10. • May be representative of females of reproductive age in Canada.
Findings Figure 1. Age and lipid adjusted linear regression model assessing the relationship between first trimester L-POPs maternal serum levels and first trimester maternal BMI for the 26 L-POPs showing statistically significant variation across BMI classes (p-value < 0.05). Expressed using a log 10 scale.
BMIvs L-POPslevels • 26/41 L-POPs show significantrelationshipwith BMI. • Relationship appearsnegative. • Reflective of the nature of the toxins being studied - highly lipophilic.
Findings Table 3. Pairwise comparisons of mean L-POP serum levels between first trimester maternal BMI categories for each 26 L-POPs determined to have a significant relationship with BMI.
PairwiseComparison • Higher L-POP levels in lower BMI classes in L-POPs showing significant variation between BMI classes (except for Parlar26 and Parlar 50). • Reflective of the nature of the toxins being studied - highly lipophilic. • Inconsistencies may be due to undocumentedweight variations in first trimester.
Findings Figure 2. Correlation between first trimester maternal weight variation and serum L-POPs levels, using Pearson’s Coefficient.
PCB118 Maternal Serum levels of PCB 118 (µg/kg) Weight Variation (kg)
Β-HCH Maternal Serum levels of PCB 118 (µg/kg) Weight Variation (kg)
Findings Figure 3. Association between first trimester maternal weight variation and serum L-POPs levels (showing L-POPs with p-value < 0.05 in >1 BMI category).
Weight variation vs L-POPs levels • No correlation between weight variation and serum L-POPs levels. • Significant variation of L-POPs levels with weight variation only in the underweight category for 5/41 L-POPs. • P-value non-significantwhenoutlierremoved. • Questionable accuracy of pre-pregnancy BMI.
Limitations • Small study population size. • Study population not representative of the Canadian population. • Urban and southern; • Older, more educated, less likely to smoke9. • No adjustment for other demographics than age and lipid levels. • No censoring methods used. • Self-reportingbias.
What’snext? Maternal BMI Maternal weight variation • Maternal serum levels of L-POPs Fetal blood cord levels of L-POPs Congenital anomalies
Conclusion • Show an association between first trimester maternal BMI and serum L-POPs levels. • Provides valuable information on a relationship that has been poorly evaluated. • Results reflective of the toxins’ characteristics. • Further research necessary in order to explore potential: • Associations between weight variation and L-POPs levels across trimesters. • Relationship with congenital anomalies.
Acknowledgement • MariameOuedraogo • Dr. Laura Gaudet • Andrea Lanes • Natalie Ryback • Dana Burke • TyeArbuckle • Elizabeth Bratton
References • Block SR, Watkins SM, Salemi JL, et al. Maternalpre-pregnancy body mass index and risk of selectedbirthdefects: Evidence of a dose-responserelationship. PaediatrPerinatEpidemiol. 2013;27(6):521-531. doi:10.1111/ppe.12084. • Stothard KJ, Tennant PWG, Bell R, Rankin J. Maternal overweight and obesity and the risk of congenital anomalies: a systematic review and meta-analysis. JAMA. 2009;301(6):636-650. doi:10.1001/jama.2009.113. • WaniaF, MacKay D. Peer Reviewed: Tracking the Distribution of Persistent Organic Pollutants. Environ Sci Technol. 1996;30(9):390A-396A. doi:10.1021/es962399q. • Lallas PL. The Stockholm Convention on Persistent Organic Pollutants. Am J Int Law. 2001;95(3):692-708. doi:10.2307/2668517. • Vizcaino E, Grimalt JO, Fernández-Somoano A, Tardon A. Transport of persistent organic pollutants across the human placenta. Environ Int. 2014;65:107-115. doi:10.1016/j.envint.2014.01.004. • Jacobson JL, Fein GG, Jacobson SW, Schwartz PM, Dowler JK. The transfer of polychlorinated biphenyls (PCBs) and polybrominated biphenyls (PBBs) across the human placenta and into maternal milk. Am J Public Health. 1984;74(4):378-379. http://www.ncbi.nlm.nih.gov/pubmed/6322600. Accessed January 30, 2017. • WHO. Principles for Evaluating Health Risks in Children Associated with Exposure to Chemicals - Environmental Health Criteria 237. 2006;(Environmental Health Criteria Series, No. 237). • “Study Overview”. MIREC, http://www.mirec-canada.ca/en/about/study-overview/. Accessed 3 March 2017. • Arbuckle TE, Fraser WD, Fisher M, et al. Cohort profile: The maternal-infant research on environmental chemicals research platform. Paediatr Perinat Epidemiol. 2013;27(4):415-425. doi:10.1111/ppe.12061. • Health Canada. Third Report on Human Biomonitoring of Environmental Chemicals in Canada. Vol 1.; 2015.
Table 2. Relationship between first trimester L-POPs maternal serum levels and first trimester maternal BMI after controlling for maternal age and lipid levels.
Findings Table 3. Pairwise comparisons of mean L-POP serum levels between first trimester maternal BMI categories for each 26 L-POP determined to have a significant relationship with BMI.