Download
1 / 40
400 likes | 595 Views
What we can learn from modeling regarding the downstream impacts of iron fertilization and permanence of ocean carbon sequestration. Jorge L. Sarmiento Princeton University with contributions from Rick Slater, Anand Gnanadesikan, John Dunne, Irina Marinov, and DOE funding.

E N D
What we can learn from modeling regarding the downstream impacts of iron fertilization and permanence of ocean carbon sequestration Jorge L. Sarmiento Princeton University with contributions from Rick Slater, Anand Gnanadesikan, John Dunne, Irina Marinov, and DOE funding
Impact of large scale-long term (millenial) nutrient depletion (NOT iron fertilization) on atmospheric CO2 Marinov et al. (in preparation); similar to Sarmiento & Orr (1991)
Effect of terminating fertilization Sarmiento & Orr (1991)
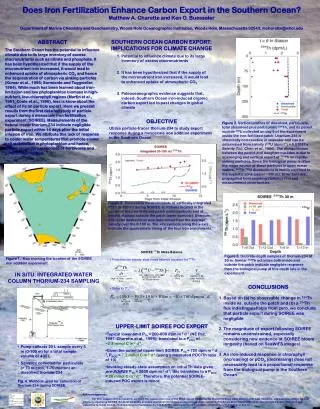
Valuable science: atmospheric pCO2 is determined by the transformation of DIC from the preformed to the remineralized pool The figure shows “potential” atmospheric pCO2 (in models with rapid gas exchange) as a function of the remineralized DIC pool (Pg C) for a wide range of model simulations 400 300 200 1000 2000 3000 4000 Marinov et al. (in preparation)
Southern Ocean nutrient depletion reduces low lat biological productivity by ~75% (Pg C/deg/yr) Nutrient depletion south of 30°S “normal” Marinov et al. (2006)
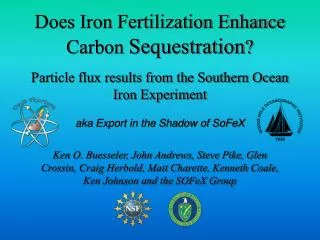
The biogeochemical divide: CO2 effects confined primarily to “blue” outcrop (AABW), productivity effects to “red” (AAIW & SAMW) SAMW AAIW CDW NADW AABW Marinov et al. (2006)
Influence of nutrient depletion in different regions of the Southern Ocean Red outcrop Reduction in atmospheric CO2 Blue outcrop Marinov et al. (2006) Production north of 35°S (Pg C yr–1)
Conclusions from large scale nutrient depletion simulations • Nutrient depletion in the Southern Ocean draws down CO2 by ~70 ppm. The North Pacific and Tropics can only draw down CO2 by ~4 ppm • Termination of fertilization leads to reversal of uptake. • The Southern Ocean biogeochemical divide • Nutrient depletion in the Subantarctic reduces low latitude biological productivity. • Nutrient depletion in the Antarctic polar zone takes up atmospheric CO2. (However, later we shall see that models show that iron fertilization is very inefficient at depleting nutrients in the polar region -- Ross Sea) • CO2 drawdown is proportional to the conversion of DIC from the preformed to the remineralized pool
Gnanadesikan et al. (2003) model of patch scale nutrient depletion • Assumption: Iron addition results in nutrient depletion. • Simulations: • Location : Eastern Equatorial Pacific at 2.2°S, 110°W • Area: One model grid cell (4°x4° = 200,000 km2) • Length of time: one month (September) • Cases considered: CASE 1 - Nutrient depletion (equivalent to“Iron added & lost”) with (a) shallow regeneration of organic matter & (b) bottom regeneration of organic matter. CASE 2 - Nutrient addition (equivalent to “Iron & macronutrients added & retained”) with (a) shallow regeneration of organic matter & (b) bottom regeneration of organic matter.
Most important result: perturbation to air-sea flux of CO2 lasts a long time and is undetectably small (macronutrient depletion, flux to bottom case) Year 1 Years 2-9
Additional results: efficiency of nutrient depletion is low, unless iron & macronutrients are added & retained After 100 years, efficiency of 1 month nutrient depletion is 2 to 12%; 40 to 42% if macronutrients are added for 1 month and then retained. (Note: this efficiency is defined as cumulative CO2 uptake over initial 1 month export flux of C at site of fertilization. Later efficiencies are defined differently.) Takes up ~0.001 Pg C (iron added & lost) to 0.1 Pg C (iron & macronutrients added & retained) per episode. Effect of additional patches scales up approximately linearly if they are separated in time, approximately 0.5x if they are separated in space. Macronutrient addition results rely on the assumption that added iron remains in the water column and labile, which is unlikely to be true.
Dutkiewicz see highest CO2 uptake in tropical Pacific, and low uptake in Southern ocean. Dutkiewicz et al. (2006) atmospheric CO2 uptake after(a) 10 years and(b) 100 years of iron input in MIT adjoint model(ton C/ton Fe) Additional iron input = 0.02 mmol m-2 yr-1 Cost function:
Motivated IFMIP (Iron Fertilization Model Intercomparison Exercize) • Sarmiento & Orr (1991) showed the Southern Ocean gives the greatest atmospheric CO2 uptake to nutrient depletion, whereas Dutkiewicz et al. (2006) got a bigger response in the Equatorial Pacific than the Southern Ocean. Why? • Atmospheric drawdown efficiency in Equatorial Pacific, appeared to be larger than Gnanadesikan et al. (2003), but it was for a different scenario and defined differently.
DOE Iron Fertilization Model Intercomparison Project (IFMIP) PARTICIPANT LIST
Model Biogeochemistry (new models have ecosystems and Fe cycle)
Iron fertilization protocol(based on Dutkiewicz et al., 2006) • Flux of 0.02 mmol m-2 y-1 bio-available iron added continuously for 10 years (Princeton/GFDL carried on to 100 years as well) • Patch locations & target patch size: • MIT patch size • (103 km2) • PAPA 50° N, 145° W 64 • EqPac 3.5° S, 104° W 97 • S. Ocean 60° S, 170° W 48 • Ross 76° S, 176° E 21 • Atmospheric pCO2 fixed at 278 ppm
Ten year CO2 uptake from atmosphere (gC m-2) Princeton model
Ratio of drawdown efficiency to MIT Drawdown efficiency = CO2 uptake/Fe addition All models are ~10x more efficient than MIT in Ross Sea; Princeton/GFDL is ~4x more efficient in S. Oc.
Southern Ocean fertilization is far more effective than other regions (Princeton/GFDL model)
Response to iron addition Reason: The Dutkiewicz et al. model is light rather than iron limited in the high latitudes. Figures show response of net community production to 10 year (a) iron and (b) light increase in MIT adjoint model (gC m-2) Increased iron input = 0.02 mmol m-2 yr-1, light increase = 30 W m-2 Response to light increase Cost function:
Atmospheric uptake efficiency in Gnanadesikan et al. Eq Pac fertilization is much lower than in new models Table shows cumulative CO2 uptake over cumulative C export over 10 years Gnanadesikan et al. (2003) efficiency is much lower than Jin & Gruber (in prep) when defined the same way. (Note correction to 71% to account for back flux to atmosphere; see later).
Lower Gnanadesikan et al. efficiency is due to greater depth of CO2 removal • Low efficiencies result from: • large area fertilization • high light sensitivity studies • Fraction of additional POC export across 100 m that occurs at base of top model layer (10 m) • Atmospheric uptake efficiency Jin & Gruber (in prep.)
Atmospheric uptake efficiency also depends on the backflux of CO2 due to reduced atmospheric CO2 Figure shows the ratio of CO2 uptake of model with variable atmospheric CO2 to a model with fixed atmospheric CO2
Conclusions based on Princeton/GFDL IFMIP model • Southern Ocean is more sensitive to iron addition than Equatorial Pacific. Dutkiewicz et al. (2006) model response to iron in high latitudes is suppressed because of light limitation. • Eq Pac iron fertilization efficiency in Gnanadesikan et al. (2003) is ~3x lower than Jin & Gruber (in prep.) due to greater depth of DIC depletion in nutrient depletion & addition scenarios. • Large scale back leakage of CO2 in models with a variable atmosphere reduces cumulative atmospheric uptake efficiency by ~20% over 10 years and ~50% over 100 years (this depends somewhat on the frequency of the iron fertilization).
Can iron fertilization deplete surface nitrate? Note Ross Sea always recovers in winter
How does fertilization affect nitrate?(Figure shows global horizontal mean of nitrate perturbation.Note: diazotroph C:N:P = 366:50:1)
Nitrate budget in 100 year continuous fertilization simulations Denitrification causes 4 Tmol NO3 loss in Eq Pac!
Contribution of iron retention: ratio of model with no iron regeneration to model with “normal” iron cycle The atmospheric uptake efficiency is insensitive to iron retention The biological export response to a given iron addition plummets to as little as 6% of the model with iron retention
Conclusions • Quantification and verification of CO2 uptake from the atmosphere for patch fertilization • Direct verification is not possible because the relevant processes are global in scale and too small to measure • Indirect verification by models requires understanding both the physical and biological efficiency and there are many uncertainties (cf. Gnanadesikan et al., 2003) • Consequences (studied in models) • Increased N2O production and degassing, which counteracts some or all of the reduction in radiative forcing by fertilization (Watson presentation) • Decreased oxygen, which leads to net loss of nitrate by denitrification when fertilization occurs in the eastern Equatorial Pacific • Loss of macronutrients from the upper ocean reduce biological productivity in other regions when fertilization ends (not shown)
Key unknowns in models • As regards the physical efficiency (air-sea CO2 uptake divided by CO2 export) • Depth of enhanced DIC removal by phytoplankton • As regards the biological efficiency (CO2 export divided by Fe addition) • Long term fate of added Fe!! • Magnitude and C:Fe ratio of enhanced uptake, export, and remineralization • Depth of remineralization
Relevance of model results to the use of iron fertilization in carbon trading • Fertilization in North Pacific and Tropics has miniscule impact on CO2 growth. In the Southern Ocean, subAA fertilization impacts low latitude productivity, AA fertilization is inefficient. • The “Faustian bargain” - Fe does not stay in the ocean, and CO2 does not stay sequestered • Direct, observable verification of CO2 uptake should be a requirement. It is not possible for iron fertilization. • Indirect verification by models has too many uncertainties and they will not be easy to overcome • Potential for negative consequences is high