Download
1 / 38
390 likes | 699 Views
Timing the Stock Market. Richard E. Neapolitan Professor and Chair of Computer Science Northeastern Illinois University Slides available at: http://www.neiu.edu/~reneapol/renpag1.htm. Stock Market Review. Corporations sell shares of the company to the public.

E N D
Timing the Stock Market Richard E. Neapolitan Professor and Chair of Computer Science Northeastern Illinois University Slides available at: http://www.neiu.edu/~reneapol/renpag1.htm
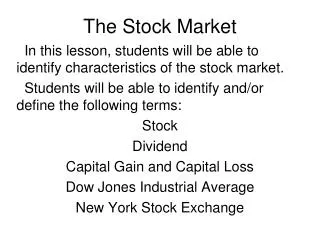
Stock Market Review • Corporations sell shares of the company to the public. • These shares are called the stock in company. • Each share of stock represents one vote on matters of corporate governance.
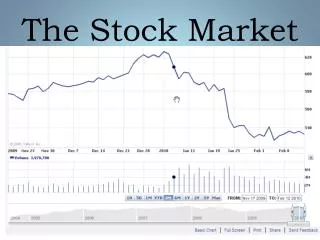
Stocks go up and down in value throughout the day, week, month, etc.
Why Do Stock Values Change? • Growth prospects of the company change. • Macro-economic variables change. • Inflation • Jobs (Non-farm payroll) • Momentum?
Stock Indices • A stockmarket index is an indicator that keeps track of the performance of some subset of stocks. • Dow Jones Industrial Average • 30 blue chip companies • Currently around 12000 • S&P 500 • 500 large U.S. companies • Currently around 1400
Common maxim: • Own stocks (Dow) if you have a long-term time horizon. • The stock market has averaged 10% yearly over the past 100 years. • So if you own stocks, in the long run you will average 10% on your investment. • Instead of the 5% or so a CD or the bank will pay.
What will market do in next 20 years? • Harvard Economist John Chapman noted the following: • Price/Earnings (PE) Ratios are way out of wack compared to historical norms. • Previously PE ratios have always returned to norms by prices going down.
None of this matters if we can ‘time’ the stock market. • Buy low • Sell high
During the 1990’s exuberant day traders made big bucks timing the market.
During the early part of this century day traders lost big bucks timing the market.
In the short term (several years) the daily values of the market seem to follow a random walk. • A number of researchers have shown this. • I ran my own ‘runs’ test indicating it.
A random walk is the result of a sequence of coin tosses. Go up one unit after a heads. Go down one unit after a tails. Eight random walks:
Fooled by Randomness • Book by Nassim Nicholas Taleb. • He argues people constantly delude themselves because they do not understand probability and are programmed to find reasons where none exist. • People end up believing in magic. • Astrology • Hot dice or coins • Hot stock markets
However, • As noted earlier, the market’s value is related to macroeconomic variables. • Perhaps we can predict the market’s performance for the coming month from information about these variables today.
We want to predict the market’s return at end of the month from information at beginning of the month. • The fact that the market’s return follows a random walk does not pre-empt that we could do this. • Suppose I toss a coin at the beginning of each month, and the market goes up or down each month based on the outcome of the toss. • The market’s return would follow a random walk even though we could predict it.
Factor Models Factor models give the value of a stock at the end of a month as a function of the values of macroeconomic variables at the end of the month.
Edwin Burmeister’s factors: • f1: Business Cycle • Monthly change in a business index • f2: Inflation • Monthly change in investment • f3: Investor Confidence • Monthly change in difference between returns on risky corporate bonds and gvmt. bonds • f4: Time Horizon • Monthly change in difference between returns on 20-year gvmt. bonds and 30-day T-bills • f5: Market Timing
We then have: ri(t) = ři(t) + bi1f1(t) + bi2f2(t) + bi3f3(t) + bi4f4(t) + bi5fk(t) + εi(t) ri(t) is the monthly return of asset i at the end of month t. ři(t) is the expected return of asset i at the end of month t. bik is the risk exposure of asset i to factor k.
Burmeister has shown that his factor model is accurate. • This shows that the market’s performance is indeed related to macroeconomic factors. • However, it does not help with timing the market since all values are at month’s end. • We want the return at the end of the month in terms of macroeconomic variable information at the beginning of the month.
Market Timing with Tony Volpon • Tony Volpon is an ex-mutual fund manager, who now spends his days, relaxing on the beach in Brazil, trying to figure out how to time the market. • He identified around 30 variables as possibly having predictive value for the S&P 500 return.
Tony’s Variables • SPFret(t) (This is what we want to predict.) [S&P(t+1) – S&P(t)] / S&P(t) • SPret(t) [S&P(t) – S&P(t-1)] / S&P(t-1) • 10Tret(t) (change in 10 year treasury bonds) [10T(t) – 10T(t-1)] / 10T(t)
Tony’s Variables • NFPret(t) (change in non-farm payroll) [NFP(t) – NFP(t-1)] / NFP(t-1) • Fedret(t) (change in federal funds) [Fed(t) – Fed(t-1)] / Fed(t -1) • Mact A complex momentum indicator
Tony’s Variables 3monthavg10T(t) = [10T(t-3) + 10(t-2) + 10(t-1)] / 3 • 10Ttony(t) [10T(t) –3monthavg10T(t)] / 3monthavg10T(t)
Regression with Tony’s Variables • We looked at about 220 months of data. • Regression for SPFret in terms of the other variables did not yield meaningful results. • Over-fitting. • In similar cases the following has sometimes worked: • Discretizing the variables. • Learning a Bayesian network from the data.
Our Study (Tony and I) • We discretized each variable into 3 ranges so as to have the same number of data items in each range. • 0 (low) • 1 (medium) • 2 high) • Example: SPFret (annualized) • 0 : < - .075 • 1 : - .075 to .294 • 2 : > .294
These results make economic sense. • We can use them to make buying rules: • If Mact = 0 and NFPTony = 1 and 10Ttony = 0 go long. • If Mact = 2 and NFPTony = 0 and 10Tony = 0 go short.
By analyzing many different markets (foreign exchanges, commodities, real estate, etc.), we can always bet only on very promising prospects.
Cheap Plug: My new book Probabilistic Methods for Financial and Marketing informatics Morgan Kaufmann is now available.