Download
1 / 40
400 likes | 603 Views
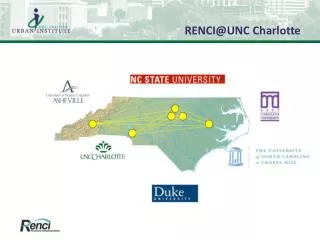
Developing a Visual Analytics Approach to Analytic Problem-Solving William Ribarsky UNC Charlotte. Two Key Statements. The purpose of visualization is insight (and practical knowledge building) not pictures.

E N D
Developing a Visual Analytics Approach to Analytic Problem-Solving William Ribarsky UNC Charlotte
Two Key Statements • The purpose of visualization is insight (and practical knowledge building) not pictures. • Visual analytics is the integration of interactive visualization and analyses to solve complex reasoning problems.
The Future Environment: The Data Problem & the Complexity Problem • The amount of data generated or observed will continue to outstrip the ability to analyze it in a deep way. • The amount of data will continue to outstrip the ability to store it comprehensively. • Comprehensive data sharing will become more and more difficult. • Databases and warehouses are becoming opaque. • Simulations and models will become even more complex and integrated.
The Future Environment: The Data Problem & the Complexity Problem Yet… • The process cannot be entirely automated. Providing meaning and direction in the analysis process requires human involvement. • Data, simulations, and simulation results are becoming so complex and large that their content is not completely knowable. They must be probed, explored, discovered. • Humans (and many times expert humans) are a very expensive and/or limited resource. • So, a significant aspect of the data and complexity problems is how to involve the human in an intimate partnership with the computer even when the problem becomes very complex and large.
What Can Visual Analytics Provide? • It provides a human-centered approach to attack the human reasoning bottleneck. • Visual analytics provides an approach that starts from integration of computer-based analysis methods and interactive visualization to support: • Reasoning and evidence gathering at scale • Exploration in context and uncovering of unforeseen relationships. • Insight discovery. A main goal of visual analytics over the next 5-10 years will be to begin attacking the data and complexity problems and resolving the human reasoning bottleneck.
Financial Transaction Data • Financial transactional data warehouses for large banks are very big (billions of records over many years). • -Knowing what to query for is a big problem. • No transaction, by itself, is risky or fraudulent. • Although data records tend to be structured or semi-structured, items can be missing, mis-categorized, have spelling or abbreviation variations, etc. • There may be unstructured free text that can be valuable.
Challenges with Wire Fraud Detection (Bank of America Example) London Singapore Charlotte, NC Indonesia • Size • More than 200,000 transactions per day • “No transaction by itself is suspicious” • Lack of International Wire Standard • Loosely structured data with inherent ambiguity
Challenges with Wire Fraud Detection London Charlotte, NC Singapore Indonesia • No Standard Form… • When a wire leaves Bank of America in Charlotte… • The recipient can appear as if receiving at London, Indonesia or Singapore • Vice versa, if receiving from Indonesia to Charlotte • The sender can appear as if originating from London, Singapore, or Indonesia
WireVis: Financial Transaction Analysis This work is supported by Bank of America and DHS. (Significantly wider deployment to other banks and financial analysts now under discussion.) Current practice has been to do database queries filtered by keywords, amounts, date, etc. and investigate using spreadsheets. This process is inadequate and inefficient because patterns of interest (e.g., fraud or risk) will change in unpredictable ways, it is difficult to be exploratory using query methods (especially for very large transactional databases), and analysts cannot see patterns over longer time periods.
The Pipeline for Financial Anomaly Analysis All transaction activity Identify Google Interactive Visualization Prioritize Report Investigate
WireVis: Using Keywords Keywords… Words that are used to filter all transactions Only transactions containing keywords are flagged Highly secretive Typically include Geographical information (country, city names) Business types Specific goods and services Etc Updated based on intelligence reports Ranges from 200-350 words Could reduce the number of transactions by up to 90% Most importantly, gives useful meaning (label) to each transaction
WireVis: Financial Transaction AnalysisSystem Overview Search by Example (Find Similar Accounts) Heatmap View (Accounts to Keywords Relationship) Keyword Network (Keyword Relationships) Strings and Beads (Relationships over Time) For full projects and publications, go to www.srvac.uncc.edu Work by Remco Chang et al.
Scalability We have connected to the data warehouse at Bank of America with 10-20 millions of records, for wire transactions alone, over the course of a rolling year (13 months). Connecting to a database makes interactive visualization tricky. Unexpected Results (Access through the VA interface!) “go to where the data is” – operations relating to the data are pushed onto the database (e.g, clustering). WireVis:Integrated with Full Transaction Database Database SQL JDBC Stored Procedure Raw Data Temp Tables WireVis Client
Performance Measurements Data-driven operations such as re-clustering, drilldown, transaction search by keywords require worst case of 1-2 minutes. All other interactions remain real time No pre-computation / caching Single CPU desktop computer WireVis is in deployment with James Price’s and the WireWatch team for testing and evaluation. It is the foundation for substantial new project on risk analysis. WireVis:Integrated with Full Transaction Database
WireVis is a general tool. Though it was developed to investigate money-laundering and fraud, it can be applied to everything from risk analysis to financial business intelligence. WireVis’s power is due to: Contextualizing in terms that are meaningful to the analyst. The context may be in terms keywords that encapsulate knowledge or tradecraft, specific procedures that describe types of transactions, or some other way. Organizing and discriminating among data using MDS, discriminating cluster analysis, filtering based on keywords, and other methods (but all based on the cognitive or conceptual space of the analysts). Supporting highly interactive exploration from overview to particular case. Some General Conclusions
Multimedia: Automated Video Content Analysis Work by Jianping Fan et al.
Multimedia: Automated Video Content Analysis • Audio and Video Analysis: Story Boundary Detection
Video Scene Understanding andSearch by Example • News Topic Detection: • Video Analysis
News Story Collection Predictor Interestingness User Preference Set of news stories Usage History Multimedia: Automated Video Content Analysis • News Interestingness Prediction Result: analysis can automatically find news (or potentially other content) in unstructured media regardless of language.
EventRiver: Determining Events • An event is an occurrence that happens at a specific time and draws continuous attention. • Events are derived from a cluster of multimedia documents that have closely related content and coincide in time. • Events are characterized by the semantics of their related documents, namely a group of interrelated significant keywords summarizing the major themes in the cluster, and the temporal information describing how the cluster strength changes over time.. Work by Jing Yang et al.
EventRiver - Visually Exploring Broadcast News Videos • Features: • Automatic incremental event extraction, • Event browsing and inspection • A rich set of navigation, search, and analysis tools. The figure shows major CNN news from August 1 to 24 in 2006 (right) and a shoebox for examining an event in details (left).
EventRiver Exploration and Filtering Search by Example EventRiver
Sentiment Analysison RSS Feeds 50 RSS News Feeds featuring the US Presidential Election in 2008 (10/9/2008 – 11/8/2008) Work by Daniel Keim and his team
EventRiver: Expanded Capabilities Sentiment Analysis Geographic/Temporal Entity Extraction Comparative Event Trend Analysis
A Data Model for News Streams • Clustered News: daily news clusters; each cluster groups all the news reports towards the same incident. Joint work between the U. Kontanz and UNC Charlotte teams
A Data Model for News Streams • A (bursty)Event: temporal divided portions of a story based on time series analysis of the statistics of clustered news. A News Story Cluster Size Date Event A B C D E
A Data Model for News Streams Are there any correlations between Story 1 and Story 2 ? News Stream Clustered News are “local”, missing temporal information Story 2 Story n Story 1 …… Clustered News Clustered News Clustered News …… …… ……
A Data Model for News Streams Events contain both Semantic and temporal information; act like routers to connect different news stories Are there any correlations between Story 1 and Story 2 ? News Stream Story 2 Story n Story 1 …… E E E E E E E E Clustered News Clustered News Clustered News …… …… ……
JRC European Media Monitor geo-tagged multilingual clustered (event detection) and categorized extracted entities • News Stream • monitoring about 4000 sources from 1600 portal in 43 languages Work by Daniel Keim and his team
Pair consisting of: - Region-of-Interest - Coordinated Visualization & Some visual connection Rendered directly within the main visualization Can be directly interacted with Powerful in multiples What is a Probe?
Why Probes? • More massive simulations • Computer experiments, requiring experimental probing of data collection & exploration of the simulation space. • Massive observational networks • Again, must be probed experimentally.
UrbanVis, Before Work by Tom Butkiewicz, Remco Chang et al.
MultitouchProbeVis • Large scale urban land use simulation • Difficult to see & understand details in context • Difficult to compare & understand trends in different areas
Evaluation New evaluation strategies and results have emerged. Learning-based Evaluation • Describe and measure knowledge gain and insights discovered. • Must separate out 3 types of learning: about the system, the data, and the cognitive task(s) at hand.
A Few Words aboutKnowledge and Insight…. • Knowledge is compact. • Knowledge begets knowledge. • Knowledge is flexible, reusable, and generalizable. • There are two types of insight • Spontaneous insight • Knowledge-building insight
Long-Term Research Goals • Establish design principles for visual analytics systems. • Develop a predictive human cognitive model. • Create a theory of interaction. • Develop a process for evaluation of exploratory, investigative, insight discovery, and knowledge-building systems. • Successfully attack large, complex real-world problems.
Questions? www.srvac.uncc.edu