Download
1 / 18
190 likes | 532 Views
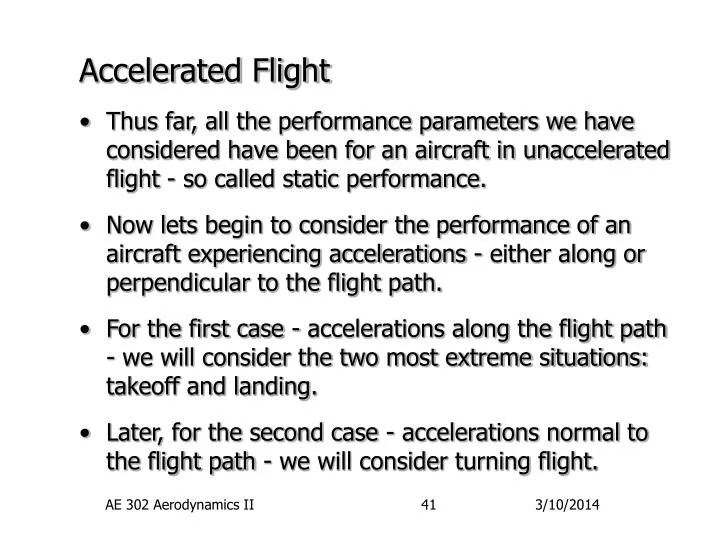
Accelerated Flight. Thus far, all the performance parameters we have considered have been for an aircraft in unaccelerated flight - so called static performance.

E N D
Accelerated Flight • Thus far, all the performance parameters we have considered have been for an aircraft in unaccelerated flight - so called static performance. • Now lets begin to consider the performance of an aircraft experiencing accelerations - either along or perpendicular to the flight path. • For the first case - accelerations along the flight path - we will consider the two most extreme situations: takeoff and landing. • Later, for the second case - accelerations normal to the flight path - we will consider turning flight. AE 302 Aerodynamics II
Takeoff Performance • An aircraft under acceleration must obey Newton’s second law: • Further, the differential change in position of the aircraft while accelerating is given by calculus: • So the distance needed to reach a given speed is: • In these relations, SG is the distance required to reach a target ground velocity, VG, starting from rest. AE 302 Aerodynamics II
Takeoff Performance (continued) • In reality, flight regulations do not specify takeoff distance by SG, but by the distance needed to clear an obstacle: • Also, for safety, the lift-off airspeed, VLOF is taken as a fraction (1.1 or 1.2) above stall speed Vstall. • Finally, if there are winds, Vwind, the ground speed differs from the target lift-off speed: rotation transition initial climb SR Strans Sclimb SG h = 50ft (FAR 23) or 35ft (FAR 25) STO or STOFL + for tail wind - for head wind AE 302 Aerodynamics II
L T D R W Takeoff Performance (continued) • Now let’s concentrate on our particular situation as illustrated below: • In addition to the familiar forces of L, W, T, and D, we also have a ground resistance force, R. AE 302 Aerodynamics II
Takeoff Performance (continued) • This resistance force is due to the rolling friction between the tires and the ground. • Assume this force is proportional to the normal force of contact: • The friction coefficient used here, r, will also depend upon the type of runway surface. Typical values are: r = 0.02 for smooth, hard runway (asphalt or concrete) r = 0.1 for grass runway (unmowed and uncompressed) • With this new force, a summary of the forces in the flight path direction gives: AE 302 Aerodynamics II
Takeoff Performance (continued) • One special note concerning drag applies to both takeoff and landing. • Due to the interaction of the ground, the wing tip vortices are weakened. • The result is both an enhanced lift, and a decreased induced drag - this is called the ground effect. • To account for this drag decrease we will use: where depends upon the height of the wing above the ground, h, and the wing span, b: AE 302 Aerodynamics II
Forces W L T T-D-(W-L) D+(W-L) D (W-L) s sLO Takeoff Performance (continued) • If the airplane forces are plotted schematically for a jet aircraft (fighter), we would see something like: • Note that all our forces vary as the aircraft gains speed. • The net axial force also varies, but not as much. • Thus, is is reasonable to replace this net force with an average value. AE 302 Aerodynamics II
Takeoff Performance (continued) • Thus, assuming that thrust is nearly constant, and angles are small the average axial force becomes: • To determine an average value for the other forces, D and R, it is suggested that the value at 0.707 the lift off velocity is used: • And, in turn, the lift off velocity is typically 1.2 times the stall speed at takeoff (or 1.1 for military a/c): AE 302 Aerodynamics II
Takeoff Performance (continued) • Putting all these assumptions together finally gives us the take off ground roll distance: or • If the total force cannot be assumed constant, we must numerically integrate: AE 302 Aerodynamics II
Takeoff Performance (continued) • To summarize our results for take off performance: • Takeoff distance increases with the square of aircraft weight! • If thrust variations with altitude are included, T , then takeoff distance increases inversely with the square of density, S 1/2! • Takeoff distance decrease with higher wing area, S, or higher takeoff CL,max. • Takeoff distance decreases with either higher thrust or reduced ground resistance. AE 302 Aerodynamics II
Takeoff Performance (continued) • Finally, the book notes that the take off distance can be minimized by maximizing the acceleration. • The acceleration can in turn be maximized by configuring the aircraft for an “optimum” CL. • Without going through the math, the book shows that the optimum CL can be found to be: • This CL would be obtained by flap settings and/or wing incidence during the take-off roll. • Use this CL in calculating the average L and D. AE 302 Aerodynamics II
Forces W L D+(W-L) D s r(W-L) sL Landing Performance • Calculations for landing performance are very similar to those for takeoff performance. • The primary differences are: • Most airplanes land with the engines at idle - T ~ 0. • The aircraft starts with an initial touchdown velocity, VTD, and decelerates to rest. • The resistance forces, drag and ground friction are intentionally large. AE 302 Aerodynamics II
Landing Performance (continued) • The balance of forces now gives: • And, as with takeoff, we will assume a constant average axial force can be defined by: • The distance relation is the same except for a negative sign to account for starting with velocity VT and decelerating to rest: AE 302 Aerodynamics II
Landing Performance (continued) • Putting all these together gives the relation: • Most aircraft approach the runway at 1.3 times the stall speed for safety reasons. • However, touch-down, after flaring, usually occurs at 1.15 times the stall speed (all aircraft), such that: AE 302 Aerodynamics II
Sdescent SG SFlare h = 50ft (FAR 23) or 50ft (FAR 25) SLanding Landing Performance (continued) • The landing maneuver usually involves an approach to the runway, a gliding decent, flare, and then touchdown and braking: • Most aircraft approach the runway at 1.3 times the stall speed for safety reasons. • However, touch-down, after flaring, usually occurs at 1.15 times the stall speed (all aircraft), such that: AE 302 Aerodynamics II
Landing Performance (continued) • As before, if we assume a constant, average force: • To increase the resisting forces and thus shorten landing distances, a number of force enhancing methods are used: • First, brakes are normally applied. This has the effect of increasing the rolling friction. For paved, dry runways, a value of r=0.4 is typical. • Also the profile drag associated with landing flaps is intentionally high - thus increasing Cd,0. AE 302 Aerodynamics II
Landing Performance (continued) • Spoilers are used on many aircraft. These upper surface, split flap like devices act to abruptly decrease the wing lift once on the ground which helps to improve the rolling friction. Spoilers also increase the profile drag. • Drag chutes use to be common on high performance fighters. And of course landing arresting systems such as on carrier ships can be used. • Finally, many airplanes can produce reversed thrust either through a mechanical system on jet engines or reversed prop pitch on piston/turboprop engines. To include reversed thrust, simply add in this term with the other resisting forces: AE 302 Aerodynamics II
Landing Performance (continued) • Alternately, you may use the approach shown in the book which assumes CD and CL are constants during landing ground roll. • As with take-off, if neither assumption is accurate for the aircraft being analyzed, you must use numerical integration of the original equation: AE 302 Aerodynamics II