Download
1 / 33
340 likes | 507 Views
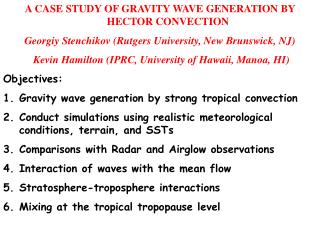
A CASE STUDY OF GRAVITY WAVE GENERATION BY HECTOR CONVECTION Georgiy Stenchikov (Rutgers University, New Brunswick, NJ) Kevin Hamilton (IPRC, University of Hawaii, Manoa, HI) Objectives: Gravity wave generation by strong tropical convection

E N D
A CASE STUDY OF GRAVITY WAVE GENERATION BY HECTOR CONVECTION • Georgiy Stenchikov (Rutgers University, New Brunswick, NJ) • Kevin Hamilton (IPRC, University of Hawaii, Manoa, HI) • Objectives: • Gravity wave generation by strong tropical convection • Conduct simulations using realistic meteorological conditions, terrain, and SSTs • Comparisons with Radar and Airglow observations • Interaction of waves with the mean flow • Stratosphere-troposphere interactions • Mixing at the tropical tropopause level
Simulations from 1-st principles and parameterizations Parameterization of a non-local wave effects depends on the resolution of the driving GCM Local/non-local conditions for convective parameterizations Non-local parameterizations are required for the models with finer spatial resolution Intermediate resolutions when nothing is working, e.g., 10-km resolution for convective parameterization
Model Regional Atmospheric Modeling System (RAMS) Nonhydrostatic Semi-implicit time-split finite-differencenumerical scheme 1-km resolution terrain 1-km resolution vegetation cover data set Land surface model – LEAF2 Vertical mixing – Mellor-Yamada turbulent closure Horizontal mixing – Smagorinsky-Lilly Nesting Bulk microphysics, Delta-Eddingthon Radiative transfer scheme Open lateral boundary conditions; Sponge layers
Simulation Setup Time period: November 16, 2001 - DAWEX IOP2 Domain: 400 x 200 x 110 km Resolution: Longitude: 2 km, Latitude: 2 km, Altitude grid spacing: from 30 to 1000 m Time step: 3 sec; 200x100X130 grid points Initialization from soundings on 11/16/01 at 0211 UTC From 0 to 30 km (Toshitaka Tsuda) UKMO 2001 U and T below 56km; URAP winds and CIRA-86 Temperature above 56 km (Robert Vincent) Simulation started at 0000 UTC
Simulated storm starts in the western part of the Tiwi’s at about 0400 UTC and reaches maximum intensity at about 0700 UTC or a little earlier. The location and timing of the storm is in a good agreement with observations. Streamlines are shown at 100 m altitude
Vertical wind (m/s) in altitude-longitude cross section at 11.5S. The field above 80 km near right boundary is contaminated by reflection from the boundary. Vertical wind (m/s) at 90 km. The top of the domain is at 110 km. In this calculations we used 130 vertical grid points.
Vertical wind (m/s) in the altitude-longitude cross section at 11.5S. Latent heat release (K/day) in the same cross section. Negative heating rates correspond to melting of falling ice particles
Experiments with Increased Domain Oriented in South-North Direction Domain: 200 x 500 x 110 km Time step: 3 sec; 100x250X130 grid points Nudging of mean potential temperature above 50 km Exponential sponge layer near lateral boundaries Experiment 7 All winds weakly nudged south of 12.5S Experiment 9 Damping of W south of 12.5S Experiment 10 Damping of W and Water Vapor south of 12.5S
A keogram constructed from airglow images taken at Katherine on November 16, 2001 (provided by Alan Liu) Waves were propagating Southward and Eastward
Conclusions • 500 km domain in South-North direction allows to simulate the wave signal in the vicinity of Katherine and Wyndham sites but larger domain is desirable • Simulated storm has good timing and location • Lateral boundary conditions work fairly reasonable • Latent heat release is consistent with W and rate of precipitation at ground • Convection over continent affects timing and distribution of wave activity, directionality • Simulated GW have reasonable parameters: λ~40km, T~15min • Zonal flow effectively filters upward propagating GW • Simulated wave propagation is consistent with the airglow observations