Classification and Prediction
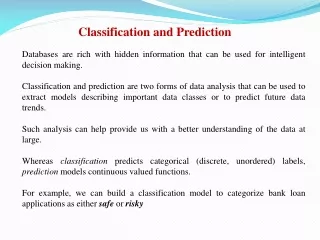
Classification and Prediction. Additional Evaluation Metrics. Lift Curve. From test set, order instances according to their probability of being correctly predicted Rank rules (J48 , JRIP) Rank probabilities (Logistic regression) Plot true positive percentages

Classification and Prediction
E N D
Presentation Transcript
Classification and Prediction Additional Evaluation Metrics
Lift Curve • From test set, order instances according to their probability of being correctly predicted • Rank rules (J48 , JRIP) • Rank probabilities (Logistic regression) • Plot true positive percentages • Compare against baseline (overall prediction accuracy for the class)
ROC Curve • Receiver Operating Characteristic • Useful to find instances that have high proportion of positives • Plots counts of true positives versus false positives for a given class from test set. • The closer to upper left corner the better
ROC Curve in WEKA Left click classifier results and choose Threshold Curve
Cost Considerations • Cost / Profit Matrix • Bank example: decide whether to offer Personal Equity Plan (PEP) • True Positive: Payoff is $1000/customer • True Negative: $0 • False Positive: -$10/customer • False negative: -$1000/customer (opp. Cost)
Bank Example • Run J48, JRIP and Logistic • Use Percentage Split 66/34 for test • Compute Total Expected Cost/Profit for each method. Assume 1000 customers in the consideration set. • Generate ROC curves for each method, for both “YES” and “NO” predictions.