Download
1 / 47
480 likes | 645 Views
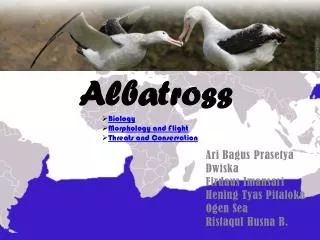
A spatial integrated population model applied to black-footed albatross. Simon Hoyle Mark Maunder. Background. Black-footed albatross Phoebastria nigripes Breed on north-western Hawaiian islands Genetically distinct population on Torishima island

E N D
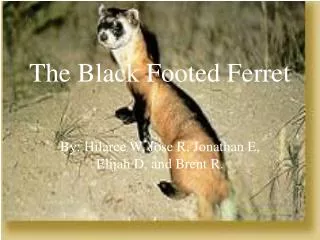
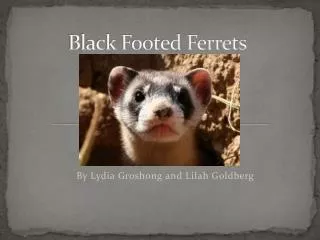
A spatial integrated population model applied to black-footed albatross Simon Hoyle Mark Maunder
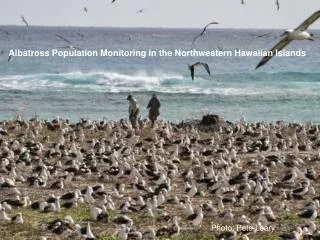
Background • Black-footed albatross Phoebastria nigripes • Breed on north-western Hawaiian islands • Genetically distinct population on Torishima island • About 60000 breeding pairs in Hawaiian population • Conservation status • Endangered (IUCN) • Petition (US ESA)
Project • PFRP – integrated modelling for protected species • Current status • 2 models • Hoyle & Maunder • Maunder, Alvarez-Flores & Hoyle
Model structure • Spatial effects at 2 levels • Sub-populations on islands and island groups • Kure, Midway, Pearl & Hermes Reef, Lisianski, Laysan, French Frigate Shoals (FFS) • FFS also broken down into Disappearing, East, Little Gin, Gin, Round, Trig, Tern, and Whale-Skate islands • Spatial and temporal overlap of birds and fishing effort • Bycatch from pooled population • Birds interact with fishing vessels • Bird distribution depends on age and stage • Integrated analysis • Fitting to multiple data types
Nest and fledgling counts • Collated in Cousins and Cooper 2001 • Timing of counts • Year = fledge year • Nests = counts of nests or pairs, Dec – Jan • Fledglings = counts of chicks or fledglings, May – July
Fishing selectivity • Catch at age • Recapture of tagged birds (C&C 2000) • Ageing of Canadian longline bycatch • Above strongly suggest higher juvenile selectivity • Potential extra sources • Timing of Hawaiian longline fishery captures • Samples from driftnet fisheries at Burke Museum, U Washington (60+) • Samples from Hawaii LL fishery
Population model (HM) • Multi-state age-based model • Recruitment • Dynamics • Initial conditions • Likelihoods
Important population processes • Spatial and temporal relationships of fishing effort and bird distribution • Selectivity (catchability of different life stages) • Skipping breeding & breeding success by island • Density dependence • Movement between islands? • Recruitment • As adults
Migration • Seems important for dynamics at the local scale • Whale-Skate island disappears • After a number of years, Trig island pop increases(?) • Tern island grows too fast? • Impractical to estimate, and may not be significant between island groups • No linkage with Torishima
Model structure • 5 stages • juvenile • immature • successful breeder • unsuccessful breeder • non-breeder • Population structured by colony, time, stage, & age • Dynamics in 2 stages: N’(t)=N(t)•survival N(t+1)=N’(t)•transition
Effort in each fishery by grid varies through time Distribution of birds and effort • Bird distribution varies by season, stage, and year • Spatial and temporal effects in Hawaiian catch rates • Distribution can be inferred from telemetry, Hawaiian bycatch
Stage transitions (breeding) Attempt breeding (i.e. NB or SB/UB) Successful breeding (i.e. SB or UB)
Initial conditions • Initial recruitment per colony Rzeroc • Projected across age classes at time tstart given natural mortality and transition rates
Expected values and Likelihoods • For fitting to • Bycatch • Counts (nests and fledglings) • Tagging data • Breeding success
Bycatch (lognormal LL) Counts (lognormal LL)
Tagging data • Observed survival • Transition rates use a similar approach – adding up estimated transitions • Likelihood • Multivariate normal fit to Hessian
Breeding success (binomial likelihood) • Expected value
Estimated parameters • Currently only • Rzeroc • ac (colony effect on p(breed successfully) • qf (catchability by fishery) • All other parameters currently fixed
Results • Fit to • Count data • Mark-recapture • survival • Return rate • Bycatch estimates • Breeding success • Total bycatch • Population trajectories
Conclusion • Modelling in progress • Algorithm working • Preparing new distribution data • Important question for managers is overall population trend • Interesting to examine what processes may explain differing population trends by island • Breeding success • Recruitment/migration rates • Differential fishing mortality
To Do • Initial conditions – check and fix • Density dependence