Elasticity Overview
Elasticity Overview. Macroeconomics of Agriculture AGEC 430 Spring 2010. D. D. S. S. Market Equilibrium. Price. S. D. Initial market equilibrium. P e. Quantity. Q e. Demand/Supply Model. Demand equation : Q d = a 0 - a 1 (Price) + a i (demand shifters) Supply equation :


Elasticity Overview
E N D
Presentation Transcript
Elasticity Overview Macroeconomics of Agriculture AGEC 430 Spring 2010
D D S S Market Equilibrium Price S D Initial market equilibrium Pe Quantity Qe
Demand/Supply Model Demand equation: Qd = a0 - a1(Price) + ai (demand shifters) Supply equation: Qs = b0 +b1(price) + bi (supply shifters) Market equilibrium: Qd = Qs To forecast price, substitute demand and supply definitions into the equation for market equilibrium and solve for price.
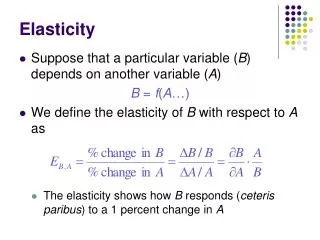
Concept of Elasticity Demand elasticities Own price elasticity = %Q/ %P Income elasticity = %Q/ %Y Cross Price elasticity = %Q/ %Px Related concept Price flexibility = %P/ %Q
Elastic Demand Curve Price c Pb Drop in price Brings about a larger increase in the quantity demanded Pa 0 Qb Qa Quantity
Elastic Demand Curve Price Producer revenue increases since %P is less that %Q. Revenue before the change was 0PbaQb. Revenue after the change was 0PabQa. c a Pb b Pa 0 Qb Qa Quantity
Elastic Demand Curve Price Producer revenue increases since %P is less that %Q. Revenue before the change was 0PbaQb. Revenue after the change was 0PabQa. c a Pb b Pa 0 Qb Qa Quantity
Elastic Demand Curve Price Producer revenue increases since %P is less that %Q. Revenue before the change was 0PbaQb. Revenue after the change was 0PabQa. c a Pb b Pa 0 Qb Qa Quantity
Inelastic Demand Curve Price Pb Drop in price Pa Brings about a smaller increase in the quantity demanded Qb Qa Quantity
Inelastic Demand Curve Price a Producer revenue falls since %P is greater than %Q. Revenue before the change was 0PbaQb. Revenue after the change was 0PabQa. Pb b Pa 0 Qb Qa Quantity
Inelastic Demand Curve Price a Producer revenue falls since %P is greater than %Q. Revenue before the change was 0PbaQb. Revenue after the change was 0PabQa. Pb b Pa 0 Qb Qa Quantity