
Distributions, Iteration, Simulation
E N D
Presentation Transcript
Distributions, Iteration, Simulation Why R will rock your world (if it hasn’t already)
Simulation • Sampling • Calculation • Iteration • Data storage • Summation
General structure of common functions on distributions • There are many distributions in R (e.g. norm is Gaussian) • For every statistical distribution in R, there are 4 related functions • d: density • p: probability distribution • q: quantile • r: random number generation • e.g. rnorm(10) draws ten values randomly from a standard normal distribution • Like most R functions, one can alter the defaults by specifying additional parameters. What parameters can be altered varies by distrubution
output > dnorm(0) <-default mean=0, sd=1 [1] 0.3989423 input > pnorm(2) <-default mean=0, sd=1 [1] 0.9772499 output input
> qnorm(.40) [1] -0.2533471 input output > rnorm(100, mean=0,sd=1) [1] 0.66075674 -0.55118652 0.08139252 0.46958450 -0.05435657 -0.86266560 1.07616374 [8] 0.16302857 -0.89804740 -0.78564903 0.29835536 -0.71735186 -1.51407253 0.89670212 [15] 1.18914054 0.48275543 -0.07937962 -0.79158265 0.66515914 0.91851769 -0.46559128 [22] 0.73002690 0.28342742 -1.15366595 1.22958479 0.50383209 -0.42909720 -0.69166003 [29] 0.16479583 1.15306943 -0.34162134 -1.10417420 0.74769236 1.09840855 -0.51784452 [36] 0.70605966 0.28660515 -0.62594167 -0.20681508 -0.69174153 -0.85814328 -0.23921311 [43] -0.13501255 -0.26683858 -1.67594580 1.19625453 -1.46812625 0.65995661 -0.79434250 [50] 0.51520368 -0.63391224 -0.16388674 -1.19557850 0.57594851 -0.32403622 -0.69371174 [57] -1.12080737 -0.28248934 1.40289924 0.82057604 -0.78505396 -0.05197960 -1.04549759 [64] -0.01334230 1.46494433 -0.18540372 -1.80950468 -0.18717730 -0.20780014 -0.07233845 [71] 0.11554796 0.83534676 -1.28519697 0.41796046 -1.48320795 -0.37269167 1.33504531 [78] 2.89549729 1.19711458 -0.11064494 1.23430822 0.42402993 -0.70746642 -1.01444881 [85] 1.19138047 -0.24913786 -0.29479432 0.21643338 0.50766542 0.69286785 -1.58078913 [92] -0.10119364 -0.44138704 -0.81407226 -1.57577525 2.83165289 -0.55277727 -1.50489032 [99] 0.09719564 0.75148485
rnorm(): uni normal mvrnorm(): multi normal rbinom(): binomial runif(): uniform rpois(): poisson rchisq(): 2 rnbinom(): neg. binomial rlogis(): logistic rbeta(): beta rgamma(): gamma rgeom(): geometric rlnorm(): log normal rweibull(): Weibull rt(): t rf(): F … Simulating random variables in R
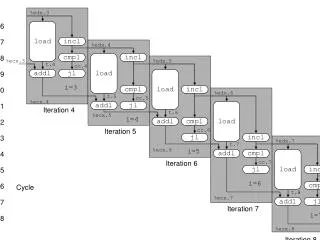
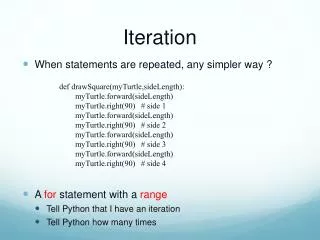
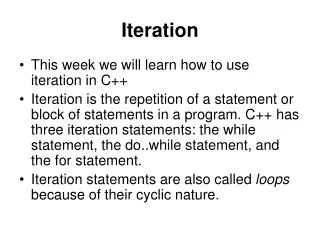
loops • for() and while() are the most commonly used • others (e.g. repeat) are less useful for(i in [vector]){ do something } while([some condition is true]){ do something else }
for loop { for (i in 10:1){ + cat("Matt is here for ", i, " more days \n") + } cat(“Matt is gone”) } Matt is here for 10 more days Matt is here for 9 more days Matt is here for 8 more days Matt is here for 7 more days Matt is here for 6 more days Matt is here for 5 more days Matt is here for 4 more days Matt is here for 3 more days Matt is here for 2 more days Matt is here for 1 more days Matt is gone
The Elementary Conditional • if if([condition is true]){ do this } if([condition is true]){ do this }else{ do this instead } ifelse([condition is true],do this,do this instead)
Conditional operators == : is equal to (NOT THE SAME as ‘=‘) ! : not != : not equal inequalities (>,<,>=,<=) & : and by element (if a vector) | : or by element && : and total object || : y total object xor(x,y): x or y true by not both
Other useful functions: • sample(): sample elements from a vector, either with or without replacement and weights • subset(): extract subset of a data frame based on logical criteria
Time to get your hands dirty • Open up the R file sim.R • Different scripts separated by lines of “#” • Two approaches to the CLT • Exercise #1 • Simple ACE Simulator • Simple Factor model/IRT simulator • Exercise #2 • “solutions” to exercises at the bottom
The frequency of an allele at t+1 is dependent on its frequency at t. The binomial distribution might come in handy There are many ways to model this phenomenon, more or less close to reality Exercise #1: Create a simplegenetic drift simulator for a biallelic locus N=100 N=1000 (source: wikipedia)
Simulating Path Diagrams • Simulating data based on a path model is usually fairly easy • Latent variables are sources of variance, and usually standard normal • path coefficients represent strength of effect from causal variable to effect variable. • Drawing simulations using path diagrams (or something similar) can help formalize the structure of your simulation
ACE Model • 2 measured variables • 6 sources of variance • 3 levels of correlation • 1, .5, or 0 • Standard normal latent variables Effect of latent variable on phenotype = factor score * path coefficient Phenotype #2 Phenotype #1
mvrnorm() • part of MASS library • Allows generation of n-dimensional matrices of multivariate normal distributions • Also useful for simulating data for unrelated random normal variablesefficient code and less work
mvrnorm() == simplicity • mvrnorm(n,mu,Sigma,…) • n = number of samples • mu = vector of means for some number of variables • Sigma = covariance matrix for these variables • Example: • mu<- rep(0,3) • Sigma<-matrix(c(1,.5,.25,.5,1,.25,.25,.25,1),3,3) • ex<-mvrnorm(n=500,mu=mu,Sigma=Sigma) • pairs(ex)
Factor Models • Similar principles • In a simple model, each observed variable has 2 sources of variance (factor + “error”) • Psychometric models often require binary/ordinal data
Exercise #2: Generate a simulator for measuring the accuracy of Falconer estimation in predicting variance components MZ DZ
Hints: • Simulation: • The EEAsim6.R script contains a twin simulator that will speed things up. • source(“EEAsim6.R”) will load it. function is twinsim() • “zyg” variable encodes zygosity; MZ=0, DZ=1 • Variables required here are numsubs, a2, c2,and e2 • Calculation: • cor(x,y): calculate the Pearson correlation between x and y • Falconer Estimates • a2 = 2*(corMZ-corDZ) • c2 = (2*corDZ)-corMZ) • e2=1-a2-c2 • Iteration: a “for” loop will work just fine • data storage: perhaps a nsim x nestimates matrix? • visualization: prior graph used plot and boxplot, do whatever you want