Download
1 / 17
180 likes | 351 Views
The XMM Distant Cluster Project: Survey limits and Pilot Survey. Georg Lamer A. Schwope, V. Hambaryan, M. Godolt (AIP) H. Böhringer, R. Fassbender, P. Schücker, J. Santos (MPE) C. Mullis (U Michigan), P. Rosati (ESO). Extended source detection and survey sensitivity X-ray redshifts

E N D
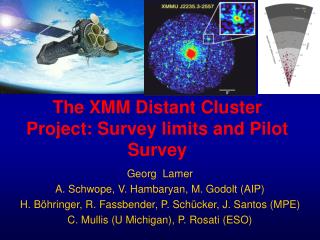
The XMM Distant Cluster Project: Survey limits and Pilot Survey Georg Lamer A. Schwope, V. Hambaryan, M. Godolt (AIP) H. Böhringer, R. Fassbender, P. Schücker, J. Santos (MPE) C. Mullis (U Michigan), P. Rosati (ESO)
Extended source detection and survey sensitivity • X-ray redshifts • 3. First results from pilot survey
eexpmap exposure maps EPICimages eboxdetect esplinemap background maps emldetect PSF fiiting eboxdetect Source detection pipeline • Standard XMM-SAS detection tasks • Similar setup as for 2XMM catalogue
Source detection pipeline emldetect: Fitting PSF folded with King profile
Verification of survey limits Simulation of XMM EPIC data: • Simulate 100 source lists with AGN logN-logS (Hasinger & Brandt 2005) + cluster logN – logS (Rosati et al. 1998) • Create simulated EPIC images in 3 x 5 energy bands (typical background, 20 ksec exposure). Run source detection pipeline on fake data sets.
Verification of survey limits Detected fraction: ~50% @ f=10-14 Spurious fraction (before visual screening)
Mekal redshift=0.8 kT= 4.0 X-ray redshifts • Possibility of measuring redshifts from X-ray spectra? • Extracted spectra of 90 clusters with > 500 counts, calculating grid of MEKAL models in T-z plane (Master thesis M. Godolt).
X-ray redshifts Determined 17 redshifts (mostly low T clusters @ z< 0.5)
X-ray redshifts Newly discoveredcluster @ z=0.8: Subaru I-band
Pilot cluster survey • Survey area: 9 deg2 at sensitivity 7x10-15 cgs • Best sensitivity:10-15 cgs • Detected 155 extended sources • Optical follow up in ESO P72 / P73 (2003/2004)
Optical follow up observations • Select high redshift cluster candidates using DSS images • Eliminate non-cluster identifications • Select DSS blank fields for R + z band imaging with VLT FORS2 • VLT imaging in R + z bands (47 candidates) • Estimate photometric redshifts • Spectroscopic confirmation (VLT FORS 2)
. z~1.2 VLT imaging • Imaging observations with FORS 2: • R and z bands • Rlim > 24.5 , zlim > 23m • Determine R-z colours cluster red sequence redshift estimate
10 Pilot survey: Results Photometric (R-z) redshifts
XMMU J2235-2557 z = 1.39 Mullis et al. 2005
Conclusions & Outlook • Survey sensitivity well described by simulations. • Limited possibility to obtain redshifts from XMM spectra. • Pilot survey demonstrated efficient strategy to find distant clusters • ~ 1/4 of new XMM clusters at z > 0.5 • ~ 1/4 of these have z > 1.0 • XMM 2235-2557: X-ray luminous cluster at z=1.39 • Next goal: sample of 30 clusters at z >1