Download
1 / 17
170 likes | 321 Views
DESIGN OPTIMI Z ATION OF A SOLAR RACE-CAR WITH ENERGY MANAGEMENT APPROACH. O.Ustun, M.Yilmaz, C.Gokce, U.Karakaya, R.N.Tuncay İstanbul Technical University & Mekatro R&D Co. Vehicles. Formula G races are organized by Scientific and Technological Research Council of Turkey since 2005.

E N D
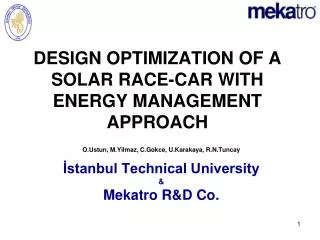
DESIGN OPTIMIZATION OF A SOLAR RACE-CAR WITH ENERGY MANAGEMENT APPROACH O.Ustun, M.Yilmaz, C.Gokce, U.Karakaya, R.N.Tuncay İstanbul Technical University & Mekatro R&D Co.
Vehicles • Formula G races are organized by Scientific and Technological Research Council of Turkey since 2005. • Almost 40 university solar-race cars participate • This study presents the design methodology of İstanbul Technical University solar-race cars. • Three Cars have been developed so far. ARIba-1, ARIba-2 and İTÜ-Ra. • ARIba-1, winner of all 2006 races. The Aegean Cup and Istanbul Park Cup. • ARIba 2, runner up of 2006 Aegean Cup and Istanbul Park Cup, runner up of 2007 and 2008 races. • İTÜ-Ra, winner of 2007 and 2008 races.
ARIba-1 Two front wheels One driven rear wheel Weight = 230 kg (with Lithium Ion battery) Direct Drive BLDC Motor Voltage = 0 - 330 V Power = 3.5 kW Max rpm = 985 min-1 Efficiency = % 91 Cont. Max Torque = 90 Nm Installed Solar Power = 800 W Actual Solar Power (noon) = 550 W Battery Energy = 2000 Wh Max Speed = 100 km/h Solar DC Bus Voltage = 150 V DC/DC converter = 6 kW Input 150 V / Output 330 V PWM Inverter = 10 kW Switching frequency = 8 kHz
ARIba-2 and İTÜ-Ra İTU-Ra Electrical Supply and Drive Unit same as ARIba-1 Both cars have two front wheels and one rear wheel Weight = 170 kg ARIBA-2 Direct Drive BLDC Motor Voltage = 0 - 150 V Power = 3 kW Max rpm = 750 min-1 Efficiency = % 93 Cont. Max Torque = 90 Nm PWM Inverter = 10 kW Switching frequency = 8 kHz Solar Area = Approx. 7.5 m2 Actual Solar Power(noon) = 850 W Battery Energy = 1000 Wh Max Speed = 85 km/h Solar DC Bus Voltage = 150 V
SIMULINK MODEL OF THE VEHICLESimulink Model of the Body and Mechanical Loads (Blue)Simulink Model of Solar-Cells, Battery and SOC ( Yellow, Dark Green and Red)Simulink Model of Drive and Transmission Systems (Light Green)Measurements and Data Acquisition System (White)
THE MODELLING AND SIMULATION Vehicle Load Block: Fw=ct.m.g.cosαwheel friction force Fs=m.g.sin α slope force Fa=0.5.cr.d.Af.v2air resistance force Fac=m.dv/dt acceleration force Where, ct tire-friction coefficient, m mass, g free-fall gravity, α slope, cr air-friction coefficient,dair density, Af front area perpendicular to the motion, and v is speed. Ftot = Fw+Fs+Fa+Fac total required force Pmot = Ftot.v drive power Tm = Pmot/ ωmdrive torque
Drive System Simulation • Va = Ia.Ra + La.dIa/dt + Ea • Ea = ωm.Ke • Tm = Ia.Kt • dωm/dt = (Tm-Tl)/m.r2 • v = ωm.r • Pelk = Vbus.Ia • Battery Discharge Block • A special battery model is developed to take instantaneous currents (discharges) into account, • integration of instantaneous discharges yields SOC of the battery. • This method is particularly useful for Li-Ion batteries, which are sensitive to excessive currents
Modeling of the Race TrackTwo Dimensional Segment Model of Formula G İstanbul Park Race Track
Vehicle-model virtually runs on virtual race track for earlier defined scenario • Energy consumption and performance values are computed. • Optimum race performance is obtained such that, vehicle should run as fast as possible without completely flat the battery before the finish line. • Optimum race scenarios are defined by taking various solar power/weather conditions (clouds, afternoon etc.)
Simulation results of ARIba’s virtual run on İstanbul Park race track for optimum scenario Vehicle speed variation in time for the 1st and 2nd legs Motor current variation in time for the 1st and 2nd legs Consumed energy variation in time for the 1st and 2nd legs
BLDC Motor Electronic Driver View of Rear Wheel and BLDC motor • CAN bus system collects DC bus voltage, solar current, battery current, motor voltage and current information • This information is transferred to main computer to calculate the instantaneous power and its integration (energy) Telemetry System
Energy Management Program • This program uses the data coming from the vehicle during the race and calculates all energy values and SOC of the battery. • Compares whether consumed energy is in good agreement with that of scenario. • Predicts energy requirements for the next parts of the race for existing scenario. • Finally revises performance scenario suitable to the current weather and other race conditions.
Conclusions • Solar cell output voltage, dc bus voltage and battery voltage are carefully selected such that even in a cloudy whether, solar power should easily charge the battery. • Vehicles aerodynamic and mechanical structure are robust and efficient. Road handling is effective. • Vehicles dynamic computer-model is developed. • Energy consumption for every road condition for every speed and acceleration is calculated.
Conclusions • Directly coupled electric-drive system’s efficiency is high. • Electric drive system is robust and provides the required torque from standstill to maximum speed. • Computer model of electrical and electromechanical systems is developed. Power values of solar cell, dc bus, electric motor and battery are computed. • Special attention is paid to calculate the SOC of the battery by taking fast changing load conditions.
Conclusions • Computer model of the race track is developed and vehicles energy consumption be calculated for various acceleration and speed values. • An Energy Management Software is developed to compute (instantaneous) power and (integrated) energy values for various drive scenarios on the test track. • A data acquisition and RF transmission system is developed to record the actual electrical and mechanical data. This system feeds data to Energy Management Software and controls the performance of the vehicle during the race.
Conclusions If any vehicle’s battery becomes flat before the race finish line, without any unusual event, THIS IS AN EXAMPLE OF BAD ENGINEERING If any vehicle’s battery remains partially charged after the race finish line, THIS IS NOT A GOOD ENGINEERING EXAMPLE EITHER