Download
1 / 34
370 likes | 566 Views
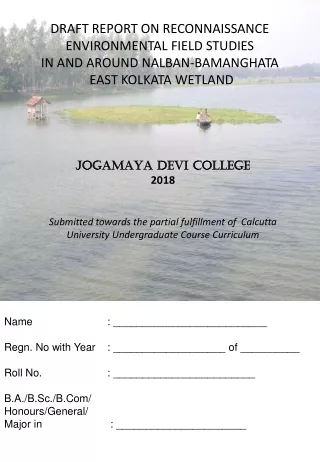
DRAFT REPORT ON RECONNAISSANCE ENVIRONMENTAL FIELD STUDIES IN AND AROUND NALBAN-BAMANGHATA EAST KOLKATA WETLAND. JOGAMAYA DEVI COLLEGE 2018 Submitted towards the partial fulfillment of Calcutta University Undergraduate Course Curriculum. Name : __________________________

E N D
DRAFT REPORT ON RECONNAISSANCE ENVIRONMENTAL FIELD STUDIES IN AND AROUND NALBAN-BAMANGHATA EAST KOLKATA WETLAND JOGAMAYA DEVI COLLEGE 2018 Submitted towards the partial fulfillment of Calcutta University Undergraduate Course Curriculum Name : __________________________ Regn. No with Year : ___________________ of __________ Roll No. : ________________________ B.A./B.Sc./B.Com/ Honours/General/ Major in : ______________________
PASTE THE COUNTERSIGNED PHOTOCOPY OF REGISTRATION CERTIFICATE HERE
PASTE THE COUNTERSIGNED PHOTOCOPY OF FIELD ATTENDANCE CERTIFICATE HERE
This draft project report on Environmental Field Studies attempts to offer guidelines for student participants for preparing a final report, individually. This report is compiled by faculties based on field data (collected during field visits on 15th , 16th , 18th and 19th January , 2018), published reports and additional sources. Students are encouraged to improve this draft report with the input of additional data, illustration(s), detailed observation, etc in their final Field Report. A tentative format is given in the back pages that may be followed for preparing the project report. • Students are instructed to enter their Name, Regn. No. with Year, Roll No. and Subject Combination in the front page of the final report. • Students are advised to download the draft report from Notice Board of Jogamaya Devi College website on and from 15th. February, 2018 (on or after 13.00 Hrs.)at: • http://www.jogamayadevicollege.org/ • Format for Report: A4 pages: typed/hand-written/ channel bound/spiral bound). • Date of submission of final report: • 26th Feb.- B.Sc. Hons. and B.Sc. Gen. • 27th Feb.- B.A. Hons. and B.A. Gen. and Major • 28th Feb.- B.ComHons. and Gen. • Venue for submission: New Building, Jogamaya Devi College (Mr. TapanBarui) • Time: 8am to 11.30 am (each day).
INTRODUCTION EAST KOLKATA WETLANDS (EKW) situated in the vicinity of Kolkata metropolis provides ample opportunity for environmental studies. This wetland forms a part of Sundarban Delta and constitute a significant ecosystem that supports a diverse fauna at the interface of dry terrestrial and permanent aquatic habitats. East Kolkata Wetland forms a part of the extensive inter distributory wetland regimes formed by the Gangetic delta. As an apex of delta this area covers 12,500 ha comprising 5,852 ha of water bodies with 3,899 ha used for fish farming, 4,960 ha of agricultural land, 603 ha for garbage farming 1,235 ha and 91.5 ha for rural and urban settlement respectively. EKW serves as a “kidney” to Kolkata, receiving 250 million gallons of humanwastewater daily. Along with the treatment of sewage water, it supports the livelihood of sixty thousands of people by utilizing the nutrients contained in the wastewater in fish farming and irrigating agriculture. EKW was designated as a "wetland of international importance" under the Ramsar Convention on August 19, 2002. EKW occupies a special position for it nurtures the world’s largest wastewater fed aqua culture system. In addition to fisheries, this wetland offers a cheap, efficient and eco-friendly operating system of solid waste disposal and sewer treatment for Kolkata metropolis. It caters to the snowballing demand of Kolkata metropolis, for fish protein, vegetables and other commodities. Even a self sustaining socio-economic structure may be seen to operate in this ecospace. Last but not the least - is the fact that EKW serves as the lungs and kidneys of ailing, urbane Kolkata. It is thus, for our own interest that we take a good care of our own, ever blissful, EKW so that a dynamic equilibrium is restored and maintained in the environment gradient. Accordingly, we need to know the interactive processes operative in these areas and we need to identify major and minor conflicts intrinsic in the system to suggest probable remedial proposals. Our reconnaissance field study in parts of EKW may mark a good initiative towards that direction. Fortunately, EKW has been declared a RAMSAR site since 2002. To stop further deterioration of the system as also to restore its native state, the East Kolkata Wetlands Management Authority, Department of Environment, Govt. of West Bengal have prepared a comprehensive and Integrated Management Plan in keeping with basic guidelines of the Ramsar Convention (1971), and started implementing it.
Objective assessment of the facts and figures, relentless monitoring of control factors in this system is a dire necessity. Academic Institutions cannot shun their social obligation and they must employ their resources to work in unison with other welfare bodies and Government authorities towards a good end. East Kolkata Wetlands Management Authority (EKWMA) for management and conservation of this multifunctional wetland eco system was formed under the East Kolkata Wetlands (Conservation and Management) Act, 2006. Under this management programme the whole area has been divided into five development zones with a particular pattern of distribution of occupation (Table 1; Map 2.8) Table 1: Pattern of distribution of occupation across different development zones in EKW area Map1: Community occupational profile of East Kolkata Wetlands
STUDY AREA • The study area forms a part of East Kolkata Wetlands (EKW) lying between 22.480° ‘N to 22.525°'N and 88.450° ‘E to 88.505° ‘E, (Fig.1). • Wetlands are defined as areas of earth, fen, peat land and water body, where one would find natural/ artificial, permanent/ temporary, stagnant/ flowing, freshwater/ brackish/ saline/ marine water. Water table is usually at or near the surface or the land is covered by shallow water. • The multifunctional EKW ecosystem consists of an area of 12,500 hectares with about 254 sewage fed fisheries, small agricultural plots and solid waste farms. Besides, there are some built up areas also. • EKW supports a diverse fauna (both native and cultured) and bring about myriad benefits to mankind, providing opportunities for cultivation, sewage fed fisheries, urban waste disposal and recreation.
OBJECTIVE: Reconnaissance environmental field study was aimed at achieving the following objectives:- To learn the basic approaches and field techniques of environment studies, as far as practicable. To record field data in a systematic, meaningful way. To develop a basic understanding of the studied wetland system and its’ significance To have a preliminary area about the socio-economic scenario of the study area. Field Study & Observations • Despite the time constraints, some important facets of Environment were focused following unique approaches of different subject disciplines. This report incorporates insight gained through:- • Ecological observations • Observations on land use pattern • 3. Socio-economic observations. • 4. Health & Environment Awareness:
ECOLOGICAL OBSERVATIONS • Present study attempts to understand the basic tenets of a sustainable ecosystem operative in the sewage fed fisheries around Nalban and in the adjoining areas of EKW. • Field study involves collection of field data on soil temperature, water salinity, transparency and pH conditions in classified water bodies (feeder canal, sediment settling tanks, fish rearing ponds, partially submerged lands etc.). • Few field instances of animal activities were recorded for benthic fauna present in the study area. • A number of culturable fishes and other animal fauna and plant taxa were identified along the field traverses. • Additional information on biochemical parameters of water bodies vis-a-vis different types of cultivable fishes in this wetland were sufficed from published reports, literature and other authentic resources.
METHODOLOGY- Ecological Studies • pH of the water is measured by digital pH meter and litmus paper. • Salinity of water is measured by digital salinometer. • . • Soil temperature is measured by soil thermometer. • Transparency of water is measured by Sachi Disc. • Aquatic flora and fauna are studied by plankton net. • Location for individual study points is recorded by GPS. • Traverse details , waypoints and maps are documented from GoogleEarth. • Photographs, diagrams, write up etc. are processed using MS-Office-2007 and CORELDRAW-11 and public domain software (Surfer-6).
Field Data collected from field traverses during Ecological Studies are given in Tables below: Table-2. Water Quality in different water bodies.
TABLE-3. Animal Fauna recognized in Sewage-Fed Fisheries of EKW (including cultivable fishes)
Few examples of faunal elements documented from EKW Fig.2 (A)- crab borrow in pond mud Fig.2 (B)- swamp eel burrow in nutrient rich sewage canal Fig.2 (C)- A typical catch of cultured fishes from EKW. Fig.2 (C)- A typical catch of cultured fishes from EKW. Fig.2 (D)- Lemnaminor
2. LAND USE PATTERN A portion of study area has been mapped adopting conventional field technique to understand the basic land use pattern. . PASTE THE COUNTERSIGNED PHOTOCOPY OF LANDUSE PATTERN HERE (For Dept. of Geography)
3 SOCIO-ECONOMIC OBSERVATIONS In development zone II, in Nalbon I area, a socioeconomic survey was conducted by faculties of Economics and English departments and B.A/ B.Sc third-year students with Economics, Geography and English Advance of Jogamaya Devi College on January 18 of 2018. The students under the guidance of teachers also collected the secondary data on revenue and cost of one fishery cooperative in this area. Nalban 1 Fishery Cooperative Society Limited with its 62 members has been commanding 180 bigha of land which comprises140 bigha for fish cultivation and the remaining 40 bigha (split into 4 parcels of land) now-a-day being used for picnic spot and film-shooting. This cooperative was formed in 2002 and till 2009 the regular auditing took place on its various sources of revenue and cost. The annual audit report was used to be placed in Annual General Meeting. The present officer in charge of the cooperative society could not show the audit report after 2008-09. As it was reported by some members of the society, after the change of the government and the political regime in West Bengal the new executive committee patronized by the new ruling political party was formed. After formation of the new committee no audit report is placed before the members of the society. Seven to eight years back fishery cooperatives had been earning revenue not only from fish cultivation and selling but also from cultivation and selling of vegetables, brick production, production of horticulture, hiring out the harvester machine and so on. As the members reported at present Fishery Cooperative earns revenue only from fish cultivation and selling, renting the picnic spot and the spot for shooting. The quantity of fish harvest and revenue from various sources of Fishery cooperative during 2002 -2009 are shown respectively in Figure 3.1 and in Figure 3.2. Taking revenue and cost together Figure 3.3 however exhibit that during 2004-05 there had been significant loss to the Fishery Cooperative. Other than that in 2004-05, in most of the years, as it is found, Fishery cooperative could not earn any significant amount of surplus (Figure 3.3).
Figure 3.2 Figure 3.1 Figure 3.3 So far the household survey is concerned, our primary objective was to test the linkage between wetland resource and livelihood pattern in EKWA area. It purports to assess how far wetland ecosystem under EKWMA area plays a deterministic role in economic livelihood of the households surrounding this region and what is its implication from policy perspective. An empirical pilot study was made in a particular village namely Mundapara of Haripota a tribal village, with population migrated long time back from the neighbouring districts and states. Total 25 sample households (which are 37% of total households) were chosen in a purposive method. Household survey was conducted by the students under the guidance of the faculties with the questionnaires structured and non-structured (Questionnaire in Appendix A). Since the population in the village are exclusively migrated, they don’t have any well-defined ownership right to the land and the resource. The sustenance of their livelihood there occurs though the engagement in fish farming, agriculture and horticulture mostly in the government vested land, trading with the products there in and also in seeking employment as unskilled labour in metropolis area.
So far their homestead land is concerned they enjoy some de facto ownership right in many cases without any written authentic document like ‘patta’. ‘Patta’ was given to them as a part of Operation Barga in the Left Front Government regime. As there is every possibility of eviction and that very often takes place as political regime has changed now-a-day. Many households did not like to disclose before us the truth about their current status in land ownership. Without any defined property right and fixed source of income each of the household in this village ekes out its livelihood from multiple sources of income. They are struggling in the abject poverty and that is why we chose this population to examine how far their survival strategy is determined by the wetland resources in EKW area. So far the wet land activities are concerned we have categorized them into four groups of activities: (i) fishery (mostly as fishermen hired by fishery cooperatives and private owners), (ii) agriculture (as cultivators share croppers andagricultural labours for rice vegetables, fruits and horticulture), (iii) trading (supplying fishes and agricultural output to the wholesalers peak and lean period varies across the different activities and (iv) service of maintenance and vigilance against theft of fishes (table 3.1). All types of production from wetland resources are seasonal in character. Thus there arise some discontinuities in flows of income from production based wetland activities, which does not occur in case the member of household is engaged in the fourth occupational category, i.e., service of maintenance and vigilance against theft of fishes. For non-wetland activities seasonality however is not as much important as the job availability is. Table 3.1 Seasonality in income from wetland based activities In the household survey we collected the data on demographic characteristics of the sampled households. Considering all the family members of the households we found that in 48% of the studied households the maximum level of education of the adult male members is illiterate. The female literacy rate is further lower. For 60% of the studied households the maximum level of education among the adult female members is illiterate.
Code of level of education: ILLITERATE -1, UPTO CLASS IV-2; CLASS V –CLASSVIII-3; CLASS IX –CLASS XII -4; ABOVE CLASS XII-5 Figure 3.4 : Highest level of education among the male and female members in studied households (in %) So far so good the dependence of livelihood of households is concerned, our field study reveals that,48% of the sampled households are 100% dependent on wetland based livelihood. 22% among them are not earning any income from wetland activities. For the rest 30% of the households, sources of income are mixed with wetland and non-wetland based activities. Comparing the total per capita income of households with per capita income from wet land activities and that from non-wet land activities, it is found that average monthly per capita income (Rs.1283.17) from non-wetland based activities is higher than that from wet land based activity (which is Rs. 1001.23). Per capita income (Rs) Fig 3.5: Total per capita income of households compared with per capita income from wet land activities and that from non-wet land activities
Table 3.2 But in terms of inequality in distribution of income for non-wet land based activity income inequality is substantially higher than that of the income from wet land based activities (coefficient of variation of income from non-wet land based activity is 148. 21% compared to 99 .67% for income from wet land based activity; Table 3.2). The comparison of monthly per capita total income and also monthly per capita income from non-wet land and wet land activities across the surveyed households are graphically plotted in Figure 3.5. Under the circumstance, the dismal picture that came out from our empirical case studies, suggests for vigorous development and more efficient management of fisheries and agricultural farming to generate more income and thereby better livelihood for the inhabitant households in this particular EKW area. Annexure1: Pictures from the field studies
CONCLUSION: • The study area reveals human interference on natural fauna. • Naturally stressed wetland fauna is further challenged with human interferences. • Water parameters changes rapidly within a short distance, as induced by local input of household waste (all along the main feeder canal). Sewage fed fisheries and integrated farming schedule is also responsible for local variation of water parameters. Such quick changes are unnatural and, as such, inhospitable except for tolerant taxa. • Natural fauna is represented by benthic invertebrates (dominantly mollusks, Crustaceans, worms and annelids, rare fishes), birds and wetland vegetation (other than cultivated crops). • Cultured fishes and crops provide partial sustenance to local people and cater the demand of local food market. • Sewage fed fisheries and associated integrated farming through indigenous method helps improve the quality of water and air in the ambience. • In-depth rigorous study is required to understand and suggest improvement options as regards the ecological and socio-economic problems intrinsic in the study area.
The Survey revealed that majority of the people are below poverty line (BPL). They earn their livelihoods based on primary and unorganized sectors. Most of them depend on agriculture (80%), some of them, are of the people work in fisheries. Some of them are engaged in construction work, a few of them are small businessmen. 10% of the people work in fisheries. The economy of the village largely depends on sewage fed fishery and complimentary agriculture. They have asserted that till today they have received no aid or financial assistance from the government or any NGO or any other organization to develop their livelihood. So if we compare the two villages with respect to the benefits they have been accrued from EKW programmes, the data of the tables above reveal that Haripota village is much more fortunate in this regard compare to Tongpara. In Haripota 7 Households got the land directly from EKWMA for cultivation, 6 families got the bheris on lease for fishery and 29 families earn their livelihood working in the other fields or bheris or related activities who are the directly beneficiaries of EKW projects. But in Tongpara, only 1 family got leased land from EKW for cultivation and two families directly benefited from fishery. The most unfortunate outcome is only 2 families are indirectly benefited, i.e., they are working as casual labours to those households who are direct beneficiaries. Most of the people in Tongpara are totally in dark about the existence and benefits of EKW programmes that functions in their area. The difference of results may be due to the distance of Tongpara from the core area of EKW projects compare to the Haripota village. Most of the people have finished their education in the early stages, that is, 80% of the respondents have finished their education below the 8th standard or before Madhyamik, the secondary board examination, and only 10% of the total respondents have completed higher secondary and the rest of them have at least reached the undergraduate level of education. But there is hope for future. We have not received any reports of school dropouts and all the respondents are trying to provide their children an education to the best of their capabilities.
References: • East Calcutta Wetland management Authority • Link: http://www.ekwma.com/index.php?view=default&MenuID=20 • Ghosh, D., 2005. Ecology and Traditional Wetland Practice- Lessons from Wastewater Utilization in the East Calcutta Wetlands. Worldview, pp. 120. • Sarkar, S. et al., 2009. Sewage Treatment in a single pond system at East Kolkata Wetland, India. Water Science & Technology, p. 2309-2317. • Mitra, B., Das, S.K. and Bja, D., 2001. Wetland Ecosystem Field Guide. • Z.S.I. Publ., 2006. Utilization of Waste Water Wetlands and Biological Modules for its Conservation.