Download
1 / 65
650 likes | 657 Views
This workshop explores the effects of climate change on carbon dynamics, utilizing remote sensing, surface measurements, and modeling. Topics include the impact on terrestrial and ocean systems, as well as outstanding questions and future research.

E N D
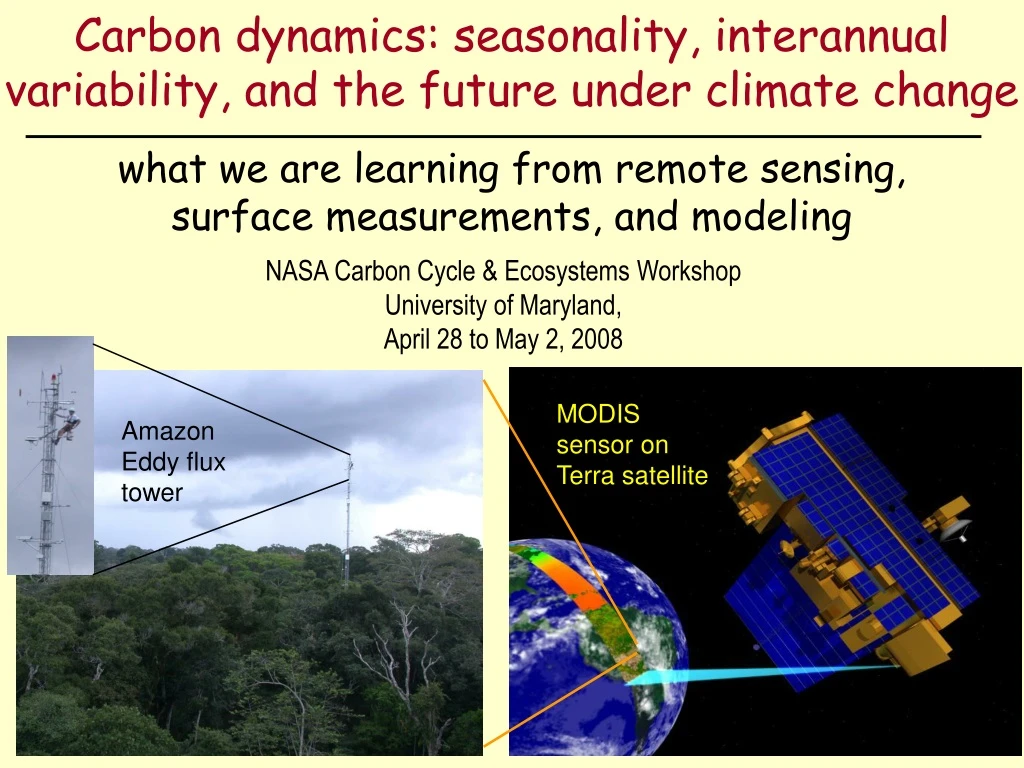
Carbon dynamics: seasonality, interannual variability, and the future under climate change what we are learning from remote sensing, surface measurements, and modeling NASA Carbon Cycle & Ecosystems Workshop University of Maryland, April 28 to May 2, 2008 MODIS sensor on Terra satellite Amazon Eddy flux tower
Carbon dynamics: seasonality, interannual variability, and the future under climate change Scott Saleska, University of Arizona Mike Behrenfeld, Sangram Ganguly, Mike Goulden, Kamel Didan, Mark Friedl, Scott Goetz, Alfredo Huete, Ranga Myneni, Piyachat Ratana, Natalia Restrepo-Coupe, Joellen Russell, Humberto da Rocha, Yosio Shimabukuro, Xiaoyang Zhang MODIS sensor on Terra satellite Amazon Eddy flux tower
Outline 1. Terrestrial Systems a. High latitude trends with climate change b. Tropical seasonality and response to drought 2. Ocean Systems 3. Summary, Outstanding questions, and future work
What is the effect of climate trends on vegetation seasonality and productivity?
What is the effect of climate trends on vegetation seasonality and productivity? Answer 10 years ago (Myneni et al., 1997): Consistent INCREASE in seasonal amplitude of satellite-derived vegetation “greenness” in Northern Hemisphere (NDVI from AVHRR) (earlier spring green-up bigger NDVI amplitude) Seasonal NDVI amplitude
What is the effect of climate trends on vegetation seasonality and productivity? Answer 10 years ago (Myneni et al., 1997): Consistent INCREASE in seasonal amplitude of satellite-derived vegetation “greenness” in Northern Hemisphere (NDVI from AVHRR) (earlier spring green-up bigger NDVI amplitude) Seasonal NDVI amplitude Also was consistent with increasing amplitude of atmospheric CO2 oscillation
Unburned Areas – Photosynthesis Trends Goetz et al. PNAS 2005 See also: Zhou et al., 2001; Angert et al., 2005; Ganguly et al., in review NDVI Changes in Unburned Areas, 1982-2003
Unburned Areas – Photosynthesis Trends Seasonal NDVI Goetz et al. PNAS 2005 See also: Zhou et al., 2001; Angert et al., 2005; Ganguly et al., in review NDVI Changes in Unburned Areas, 1982-2003
Unburned Areas – Photosynthesis Trends Seasonal NDVI Pinatubo cooling? Goetz et al. PNAS 2005 See also: Zhou et al., 2001; Angert et al., 2005; Ganguly et al., in review NDVI Changes in Unburned Areas, 1982-2003
TrendTundram ha (%)Unburned Forest Negative 2.7 ( 4%) 25.8 (22%) Near Zero 45.1 (62%) 87.9 (74%) Positive 24.5 (34%) 5.1 ( 4%) Unburned Areas – Photosynthesis Trends Seasonal NDVI Goetz et al. PNAS 2005
“Drier summers cancel out the CO2 uptake enhancement induced by warmer springs” Angert, et al. (2005), PNAS. 1.5 Trend toward earlier spring uptake with warming continues post-Pinatubo… 0 -1.5 Anomaly (ppm/yr or C/yr) 1985 1990 1995 2000 1.5 0 -1.5 1985 1990 1995 2000
1.5 0 -1.5 1.5 0 -1.5 1985 1990 1995 2000 “Drier summers cancel out the CO2 uptake enhancement induced by warmer springs” Angert, et al. (2005), PNAS. Trend toward earlier spring uptake with warming continues post-Pinatubo… Anomaly (ppm/yr or C/yr) 1985 1990 1995 2000 But trend towards increased CO2 uptake over whole-growing seasondecouples from warming.
Effects of 2003 European Heatwave reveal mechanisms consistent with long-term trends (Jolly et al., 2005) 2003 MODIS summer FPAR (relative to long-term mean)
Effects of 2003 European Heatwave reveal mechanisms consistent with long-term trends (Jolly et al., 2005) 2003 MODIS summer FPAR (relative to long-term mean)
Effects of 2003 European Heatwave reveal mechanisms consistent with long-term trends (Jolly et al., 2005) 2003 MODIS summer FPAR (relative to long-term mean)
B. Tropics: What is the seasonality of ecosystem metabolism in Amazônia?
B. Tropics: What is the seasonality of ecosystem metabolism in Amazônia? • Previous consensus answer: photosynthesis and/or transpiration decline in dry seasons: Dickenson & Henderson-Sellars (1988)Nobre et al. (1991) Tian et al. (1998) [TEM]Botta et al. (2002) [ IBIS]Werth & Avissar (2002) [ GISS GCM ]Lee et al. (2005) [ NCAR CLM] Climate and/or ecosystem models But see Potter et al. (1998) modeling study (CASA model)
B. Tropics: What is the seasonality of ecosystem metabolism in Amazônia? • Previous consensus answer: photosynthesis and/or transpiration decline in dry seasons: • LBA-Eco produced a suite of evidence suggesting a different picture: Dickenson & Henderson-Sellars (1988)Nobre et al. (1991) Tian et al. (1998) [TEM]Botta et al. (2002) [ IBIS]Werth & Avissar (2002) [ GISS GCM ]Lee et al. (2005) [ NCAR CLM] Climate and/or ecosystem models Amazonian ecosystems are not water-limited (at least over seasonal timescales) but are driven by available energy and sunlight Results partly anticipated by Potter et al. (1998) modeling study (CASA model)
Measurements across the basin 900 12 11 9 8 800 10 10 7 700 400 8 9 6 600 300 5 6 8 200 4 J F M A M J J A S O N D J F M A M J J A S O N D 100 0 J F M A M J J A S O N D Eddy Flux towers measuring photosynthesis (GPP)… A. Manaus, km34 B. Santarém (km67) C. Caxiuana GPP (gCm-2 d-1) PAR (mol m-2 s-1) precip (mm mo-1) Restrepo-Coupe, in prep.(and Araujo et al. (2002) Manaus) See poster
Measurements across the basin A. Manaus, km34 B. Santarém (km67) C. Caxiuana 900 12 11 9 8 800 10 10 7 GPP 700 400 (gCm-2 d-1) 8 9 6 600 300 5 6 8 200 4 J F M A M J J A S O N D J F M A M J J A S O N D 100 0 J F M A M J J A S O N D precip (mm mo-1) Remote Sensing(MODIS EVI) Eddy Flux towers… Huete et al. (2006)
Measurements across the basin A. Manaus, km34 B. Santarém (km67) C. Caxiuana 900 12 11 9 8 800 10 10 7 GPP 700 400 (gCm-2 d-1) 8 9 6 600 300 5 6 8 200 4 J F M A M J J A S O N D J F M A M J J A S O N D 100 0 J F M A M J J A S O N D precip (mm mo-1) Remote Sensing(MODIS EVI) Eddy Flux towers… Huete et al. (2006) Also see parallel results in LAI seasonality(Myneni et al., 2007)
The seasonality of forest metabolism: is it linked to the future of the forest under climate change? Forest? ... or Savanna?
Model-simulated responses of Amazon forest to drought: (U.K. Hadley Center model) Long-term drought(Climate change) Changes in broadleaf tree-cover By 2080: Widespread loss of Amazon forest (Betts et al. 2004) cover (fraction)
Model-simulated responses of Amazon forest to drought: (U.K. Hadley Center model) Long-term drought(Climate change) Short-term drought(e.g. El Nino) Changes in broadleaf tree-cover Hadley model-predicted GPP & precip in central Amazonia in years relative to El Nino drought El Nino Drought Forest Photosynthesis (Mg C ha-1 yr-1) By 2080: Widespread loss of Amazon forest (Betts et al. 2004) (Jones et al., 2001) cover (fraction) Years: -3 -2 -1 0 1 2 3 4
Model-simulated responses of Amazon forest to drought: (U.K. Hadley Center model) This prediction is testable! Long-term drought(Climate change) Short-term drought(e.g. El Nino) Changes in broadleaf tree-cover Hadley model-predicted GPP & precip in central Amazonia in years relative to El Nino drought El Nino Drought Forest Photosynthesis (Mg C ha-1 yr-1) By 2080: Widespread loss of Amazon forest (Betts et al. 2004) (Jones et al., 2001) cover (fraction) Years: -3 -2 -1 0 1 2 3 4
Observed response to 2005 Amazon drought precipitation anomaly Units: number of standard deviations in 2005 from the long-term mean for the July/Aug/Sept (JAS) quarter. I.e., for each pixel: Saleska, Didan, Huete, Rocha (2007), Science
Observed response to 2005 Amazon drought precipitation anomaly vegetation “greenness” anomaly Units: number of standard deviations in 2005 from the long-term mean for the July/Aug/Sept (JAS) quarter. I.e., for each pixel: Saleska, Didan, Huete, Rocha (2007), Science
Observed response to 2005 Amazon drought precipitation anomaly vegetation “greenness” anomaly Short term drought, contrary to model predictions, does not cause photosynthetic slow-down: forests may be adapted to drought, to take advantage of extra sunlight
2. Oceans: How do changes in climate affect ocean productivity?
Climate change will alter ocean phytoplankton • Stratified Oceans (low latitude) • Perpetual growing season • Nutrient impoverished surface layer • Inverse relationship b/w temperature • and phytoplankton chlorophyll Surface warming enhanced nutrient stress decreases growth rates and biomass, shallower mixing increases growth irradiance – all of which decrease chlorophyll levels low nutrient high light mixed layer restricted vertical exchange low light high nutrient deep layer
Climate change will alter ocean phytoplankton • Seasonal Seas (high latitude) • Variable growing season • Light seasonally limiting • Nutrients seasonally limiting • Positive relationship b/w • temperature and chlorophyll • Stratified Oceans (low latitude) • Perpetual growing season • Nutrient impoverished surface layer • Inverse relationship b/w temperature • and phytoplankton chlorophyll Surface warming enhanced nutrient stress decreases growth rates and biomass, shallower mixing increases growth irradiance – all of which decrease chlorophyll levels Surface warming enhanced stratification increases growing season, chlorophyll increases with improved growth rates low nutrient high light mixed layer nutrient charged low light mixed layer restricted vertical exchange enhanced vertical exchange low light high nutrient deep layer low light high nutrient deep layer
Model-based predictions • Details • Six different coupled climate models • Ocean biological responses to climate • warming from industrial revolution to 2050 • Expansion of low production permanently • stratified ocean by 4% (N) to 9.4% (S) • Significant shifts in community composition Primary Productivity change (Pg C deg-1 y-1) low-lat decreases (stratified ocean)
Model-based predictions • Details • Six different coupled climate models • Ocean biological responses to climate • warming from industrial revolution to 2050 • Expansion of low production permanently • stratified ocean by 4% (N) to 9.4% (S) • Significant shifts in community composition Primary Productivity change (Pg C deg-1 y-1) High-lat increases low-lat decreases (stratified ocean)
Satellite-based (SeaWiFS) observations Δchlorophyll Δ SST Δchlorophyll Δ stratification ‘98 ‘00 ‘02 ‘04 ‘06 Year Stratified Oceans: 1997 - 2007 I Decrease • Chlorophyll and temperature are • inversely related • - i.e., chlorophyll decreases as • temperature increases • Temperature-effect not direct • Temperature related to stratification • Stratification influences nutrients & • light, which directly effect • phytoplankton Increase Temp. anomaly (oC) El Nino warmth Chlorophyll anomaly (Tg C month-1) Stratification anomaly This Region Decrease Increase Behrenfeld et al. (2006)
Satellite-based (SeaWiFS) observations Δchlorophyll Δ SST Δchlorophyll Δ SST High Latitudes: 1997 - 2007 Decrease Increase • Chlorophyll changes in high-latitude • north larger than the south • Clear relationships between chlorophyll • and temperature • In both high latitude regions, overall • pattern is decreasing chlorophyll with • increasing temperature – this is the • opposite of what models predict High-latitude North Chlorophyll anomaly (Tg C month-1) Temp. anomaly (oC) These Regions High-latitude South Decrease Increase Behrenfeld et al. (2006)
3. Summary, Outstanding Science Questions, and Research Needs
Summary & Outstanding Science Questions • In Northern high latitude terrestrial systems:-- 1980s: earlier springs/more vegetation activity-- 1990-2000s: differential response; drought reduces vegetation activity
Summary & Outstanding Science Questions • In Northern high latitude terrestrial systems:-- 1980s: earlier springs/more vegetation activity-- 1990-2000s: differential response; drought reduces vegetation activity • Questions: -- what caused the slow-down in atmospheric CO2 after Pinatubo?
Summary & Outstanding Science Questions • In Northern high latitude terrestrial systems:-- 1980s: earlier springs/more vegetation activity-- 1990-2000s: differential response; drought reduces vegetation activity • Questions: -- what caused the slow-down in atmospheric CO2 after Pinatubo? • 2. In tropical Amazon forests: -- seasonality of ecosystem metabolism driven by available sunlight-- 2005 drought suggests Amazon forests are resilient
Summary & Outstanding Science Questions • In Northern high latitude terrestrial systems:-- 1980s: earlier springs/more vegetation activity-- 1990-2000s: differential response; drought reduces vegetation activity • Questions: -- what caused the slow-down in atmospheric CO2 after Pinatubo? • 2. In tropical Amazon forests: -- seasonality of ecosystem metabolism driven by available sunlight-- 2005 drought suggests Amazon forests are resilient • Question: what are the limits of forest tolerance of drought?
Summary & Outstanding Science Questions • In Northern high latitude terrestrial systems:-- 1980s: earlier springs/more vegetation activity-- 1990-2000s: differential response; drought reduces vegetation activity • Questions: -- what caused the slow-down in atmospheric CO2 after Pinatubo? • 2. In tropical Amazon forests: -- seasonality of ecosystem metabolism driven by available sunlight-- 2005 drought suggests Amazon forests are resilient • Question: what are the limits of forest tolerance of drought? • 3. Ocean: declines in productivity (chlorophyl) with increasing temperature, in both low latitude (stratified) and high latitude (seasonal) seas. • Question: Why ?
Future Research with a Comprehensive Earth Observation system Moderate-Resolution remote sensing (AVHRR, MODIS, VIIRS) for comprehensive spatial and temporal coverage Long-term ground observation network (e.g. FluxNet plus)
Future Research with a Comprehensive Earth Observation system • Equally long records of satellite and surface for understanding trends Moderate-Resolution remote sensing (AVHRR, MODIS, VIIRS) for comprehensive spatial and temporal coverage Long-term ground observation network (e.g. FluxNet plus)
Example: Does NDVI detect changes in vegetation phenology – or in snow cover? (discussed by Shabonov, et al., 2002; and Dye & Tucker, 2003)
Example: Does NDVI detect changes in vegetation phenology – or in snow cover? (discussed by Shabonov, et al., 2002; and Dye & Tucker, 2003) Flux-defined growing season Canadian Boreal Forest Daytime maximum uptakemol CO2 m-2 s-1 NDVI NDVI Snow-cover defined season MacMillan & Goulden (in press)
Example: Does NDVI detect changes in vegetation phenology – or in snow cover? (discussed by Shabonov, et al., 2002; and Dye & Tucker, 2003) Flux-defined growing season Canadian Boreal Forest Daytime maximum uptakemol CO2 m-2 s-1 NDVI NDVI Snow-cover defined season • Cautious interpretation needed for understanding springtime NDVI increases • Emerging long-term (~decadal) flux datasets will help MacMillan & Goulden (in press)
Future Research with a Comprehensive Earth Observation system • Equally long records of satellite and surface for understanding trends Moderate-Resolution remote sensing (AVHRR, MODIS, VIIRS) for comprehensive spatial and temporal coverage Long-term ground observation network (e.g. FluxNet plus)
Future Research with a Comprehensive Earth Observation system • Equally long records of satellite and surface for understanding trends • Better understanding of what satellite vs. surface observations measure Moderate-Resolution remote sensing (AVHRR, MODIS, VIIRS) for comprehensive spatial and temporal coverage Long-term ground observation network (e.g. FluxNet plus)
Example: What satellite index best compares to eddy flux-derived GPP? MaeKlong Tropical Forest, Thailand 3500 ) 0.8 3000 -1 mo 2500 -1 0.6 MODIS indices 2000 (kg C ha 1500 0.4 Tower GPP 1000 GPP 0.2 500 Jul Oct Jan Jun Apr Feb Dec Mar Sep Nov Aug May Month Huete et al., (in press) Multiple site tower flux and remote sensing comparisons of tropical forest dynamics in monsoon Asia, Ag. For. Met.


