Download

1 / 24
240 likes | 351 Views
This presentation explores the analysis of single nucleotide polymorphisms (SNPs) associated with pre-eclampsia using decision tree algorithms, specifically ADTree, C4.5, and ID3. Pre-eclampsia is a serious pregnancy-related condition affecting 5-8% of pregnancies and leading to significant maternal and fetal complications. The methodology includes case-control studies comparing patients with pre-eclampsia to healthy controls, leveraging decision tree analysis for classifying genetic factors. Results indicate key SNP associations, aiding our understanding of genetic susceptibility to this condition.

E N D
Standards for SNPs Analysis with Decision Trees Tools. Linda Fiaschi Supervisors: Jon Garibaldi Natalio Krasnogor IMA Seminar 24/02/2009
Outline Genetic background and clinical objectives Disease : Pre-eclampsia Method of analysis My Methodology: ADTree, C4.5, ID3 Results Conclusions Future Work 1
Genetics : SNPs • The DNA of most people is 99.9 percent the • same. • Single Nucleotide Polymorphisms (SNPs) are DNA sequence variations that occur when a single nucleotide (A,T,C,or G) is changed, which occur approximately once every 100 to 300 bases • The resulting different forms of the same gene are called Alleles. People can have two identical or two different alleles for a particular gene. 2
Clinical objectives on SNPs • The majority have no effect, others cause subtle differences in • countless characteristics, like appearance. • Genetic factors may also confer susceptibility or resistance to a • disease and determine the severity or progression of disease • Genetic factors also affect a person's response to drug therapy 3
Disease: Pre-eclampsia • It occurs during pregnancy and the postpartum • period and affects both the mother and the unborn baby. • Affecting at least 5-8% of all pregnancies, it is a rapidly progressive • condition characterized by high blood pressure and the presence of • protein in the urine. • Pre-eclampsia and other hypertensive disorders of pregnancy are • a responsible for 76,000 deaths globally each year. 4
Case-Control Analysis Case-control studies use patients who already have a disease or other condition and look back to see if there are characteristics of these patients that differ from those who don’t have the disease. Comparison Cases: Sick Controls: Healthy Classification Rules 5
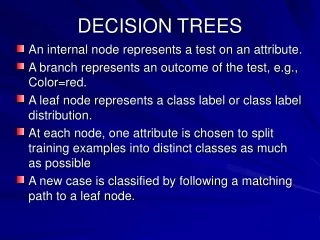
Decision Tree Analysis • One of the most widely used and practical forms of machine • learning and data mining • It assigns a class to an input pattern through tests • Test: has mutually exclusive and exhaustive outcomes • Test: is either multivariate or univariate • Attributes: is categorical or numeric • Tree: 2 classes (Boolean) or more. 6
ADTree Algorithm • They are a natural generalization of • decision trees • They are competitive with other • boosted decision tree algorithms • The rules are usually smaller in size • and easier to interpret • In addition to classification they give • a measure of confidence • For each instance there is a multi-path: • the sum of all the prediction nodes gives • the classification 8
ID3 Algorithm • Gain measures how well a given attribute separates training examples into targeted classes. • Gain(S, A) = Entropy(S) – Σ((|Sv| / |S|) * Entropy(Sv) ) • S is each value v of all possible values of attribute A • Sv = subset of S for which attribute A has value v • |Sv| = number of elements in Sv • |S| = number of elements in S • Entropy(S) = Σ((-p(I) log2 p(I)) • - S is a collection of c outcomes • - Σ is over c. • p(I) is the proportion of S belonging to class I. 9
Delivery week < 35.5 >= 35.5 Liver measures Systolic Pressure <94 >=94 <152.5 >=152.5 1(15\4) 0(25\0) 1(9\1) Age <36.3 >=36.3 1(26\2) 0(31\0) ID3 Algorithm Example 10
From ID3 to C4.5 Algorithm • Handling both continuous and discrete attributes • Handling training data with missing attribute values • Pruning trees after creation 11
Pre-processing of the Data Data Analysis Methodology A progressive analysis: detection of significant results deepened and confirmed in the subsequent analysis. 12
A Data Analysis Statistical Significance Kappa Value: proportion of agreement corrected for chance between two judges assigning cases to a set of categories A 14
Experimental Dataset • 4529 Patients • Genotype: 52 SNP attributes • AGT gene: SNPs 1-8, alleles 1 and 2 • AGTR1 gene: SNPs 9-12, alleles 1 and 2 • TNF gene: SNPs 13-16, alleles 1 and 2 • F5 gene: SNP 17, alleles 1 and 2 • NOS3 gene: SNPs 18-22 and 24, alleles 1 and 2 • MTHFR gene: SNPs 25, 26, alleles 1 and 2 • AGTR2 gene: SNP 27 • Phenotype: 53 clinical attributes • 5 individual's identity data • 34 maternal data: physical and physiological parameters, • pregnancy details and current treatments • 6 fetal data: weight and gestational age at birth • 8 medical history data of parents, partners or siblings 15
Results: Pre-processing I • Babies dataset (372X58) • Attributes: Gestation at birth (day and week), weight, disease status, live at birth • Class: CBC - birth-weight centile corrected for gestation at birth, baby sex, ethnicity, mother's height and weight and number of pregnancies. • 50 is normal weight, below 50 is underweight. • Missing Value:we retain missing values using the appropriate codification for the chosen algorithm. • Data Balancing: case-control ratio depends on the chosen CBC • threshold to transform it from numeric to Boolean. 16
Data Analysis I Kappa Analysis: 17
Results: Data Analysis II Balancing of the data: CBC = 6: 147 cases (39.5%) and 225 controls CBC = 10: 177 cases (47.6%) and 195 controls CBC = 28: 243 cases (65.3%) and 129 controls > 33% ADTree results Analysis 18
Results: Data Analysis III C4.5 Results Analysis: 19
Results: Data Analysis IV Cross Analysis: common attributes between ADTree and C4.5 20
Results: Data Analysis V Analysis with common attributes for CBC= 28 (ADTree Kappa = 0.41, C4.5 Kappa = 0.38) : Male babies, born after the 35th week of gestation and with: AGT SNP3 allele2 = 1 AGT SNP3 allele2 = 2 & AGTR1 SNP11 allele2 = 1 (CBC > 28) (CBC < 28) Analysis with only Gestational week and CBC = 10 (Kappa value = 0.42 for both the ADTree and C4.5) : Babies delivered before 35 or 35.5 week of gestation are likely to be underweight (CBC < 10). 21
Conclusions • Guideline for data mining in the specific application of case-control analysis for SNPs. • Methodological point of view: attributes are rejected, instances are decreased (screening stage). • Clinical perspective: Significance of threshold CBC = 10 and dependency of CBC on the “week of delivery”. 22
Future Work • Genotype of the mothers rather that the babies. • Recoding of the SNPs • Redundant interaction between attributes • Non linear interaction between attributes • Heritable trend can be detected across the two generations 23
References [1] J. Han and M. Kamber, Data Mining: Concept and Techniques.Morgan Kaufmann, 2006. [2] N. M. Laird and C. Lange, “Family-based designs in the age of largescale gene-association studies,” Nature Reviews Genetics, pp. 385–394, 2006. [3] J. R. Quinlan, “Induction of decision trees,” Machine Learning, vol. 1, pp. 81–106, 1986. [4] J. R. Quinlan, “C4.5: Programs for machine learning,” Machine Learning, vol. 16, no. 3, pp. 235–240, 1994. [5] Y. Freund and L. Mason, “The alternating decision tree learning algorithm,” Proceedings of the Sixteenth International Conference on Machine Learning, pp. 124–133, 1999. [6] J. Cohen, “A coefficient of agreement for nominal scales,” Educational and Psychological Measurement, vol. 20, no. 1, pp. 37–46, 1960. [7] D. G. Altman, Practical Statistics for Medical Research., Chapman and Hall, Eds. CRC Press, 1991. [8] Landis, J. R. and Koch, The measurement of observer agreement for categorical data. Biometrics. (1977) pp. 159--174 24