Optimal Steam Trap Survey Cycle Time for Major Refineries
130 likes | 183 Views
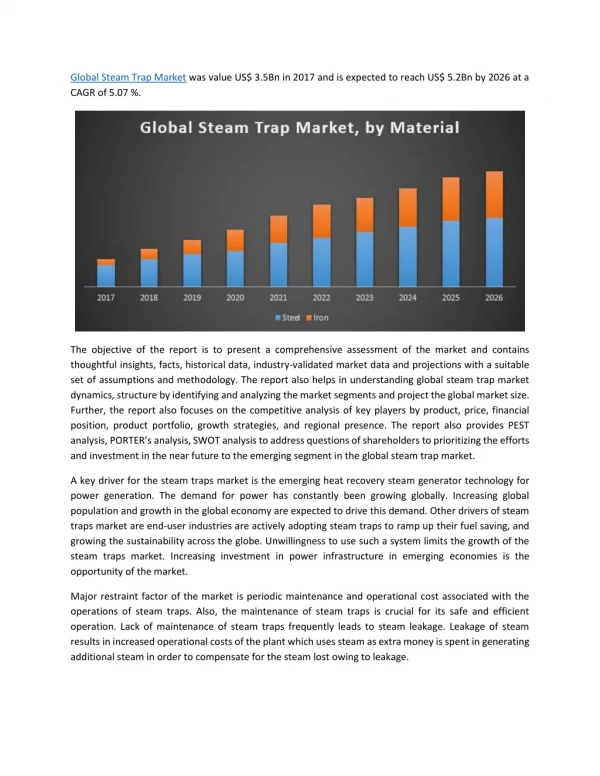
Discover the impact of survey cycle time on steam trap failure rates in major refineries. Learn how optimizing surveys can save money by reducing steam losses and improving equipment reliability. Find out recommended trap brands and models to enhance trap life. For more information on steam trap programs, contact Armstrong International, Inc.

Optimal Steam Trap Survey Cycle Time for Major Refineries
E N D
Presentation Transcript
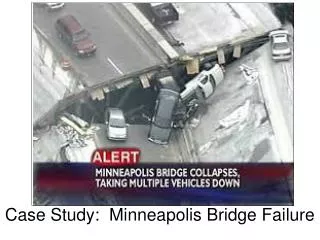
Case Study Major Refinery Steam Trap Failure Rates
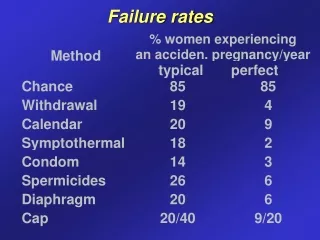
Steam Trap Survey Cycle Time versus Failure Rate Major Refinery (11 Cycles) 25% 20% 15% Steam Trap Failure Rate 10% 5% 0% 0 10 20 30 40 Months Survey Cycle Time vs Failure Rate10,000 traps, Major Refinery
Steam Trap Failure Rate vs. Survey Cycle Time Major Refinery World-Wide Steam Trap Surveys 30.0% 25.0% 20.0% Trap Failure Rate 15.0% 10.0% 5.0% 0.0% 0 10 20 30 40 50 60 Survey-to-Survey Cycle Time Survey Cycle Time vs Failure Rate80,000 traps World-Wide
How Often Should I Survey Steam Traps? • Note traps fail randomly over time. (A 10% failure rate for a population of 10,000 traps means that 1,000 traps will fail each year; after 10 years, they have all failed. • Accelerating the surveys does not reduce failures; it only finds them faster! • Finding failed traps faster & getting them repaired saves money in steam losses & improves equipment reliability. • At this refinery, a 4-mos. cycle time is optimum. • Each facility must determine the cost of more frequent surveys versus the additional steam savings realized.
150 psig Tracer Trap Failure Rate vs. 150 psig Drip Trap Failure Rate vs. Survey Cycle Time Survey Cycle Time 4,256 traps 1,992 traps 25.0% 30.0% 25.0% 20.0% 20.0% 15.0% Failure Rate 15.0% Failure Rate 10.0% 10.0% 5.0% 5.0% 0.0% 0.0% 0 10 20 30 40 0 5 10 15 20 25 30 35 40 Months Months Failure RatesDrip Traps vs. Tracer Traps Tracer Traps Drip Traps Application Effects Trap Life
600 psig Drip Trap Failure Rate vs. 40 psig Drip Trap Failure Rate vs. Survey Cycle Time Survey Cycle Time 467 traps 777 Traps 50.0% 30.0% 25.0% 40.0% 20.0% 30.0% Failure Rate 15.0% Failure Rate 20.0% 10.0% 10.0% 5.0% 0.0% 0.0% 0 10 20 30 40 0 5 10 15 20 25 30 35 40 Months Months High Pressure vs Low PressureDrip Trap Failure Rates 40 psig Drip Traps 600 psig Drip Traps Operating Pressure Effects Trap Life
12% 10% 8% % Failure Rate 6% 4% 2% 0% 40 psi 40 psi 40 psi 65 psi 65 psi 65 psi 150 psi 150 psi 150 psi 600 psi 600 psi Drip Process Tracer Drip Process Tracer Drip Process Tracer Drip Process Traps s Traps Traps Traps s Traps Traps Traps s Traps Traps traps s traps 10% 0% 2% 2% 2% 0% 9% 6% 3% 11% 0% Series1 2006 Steam Trap Failure Rate Drip traps now fail at 10% frequency, but Tracer traps fail at only 2-3% frequency. At these rates, drip traps could last as long as ten years & tracer traps as long as 30-50 years!
Options for Optimizing Surveys • Survey all traps every 4 mos. • Survey only Drip Traps every 4 mos. • Survey all Tracer Traps every 12 mos. • Use Steam Eye to go to real-time surveys!
Manufacture Failure RatesMajor Refinery Notes: 1. Total trap population is 50,000 traps. 2. Velan has less than 50 traps in this population. 3. Traps with no failure rates have less than 30 traps each in service. 4. Ogontz has less than 45 traps in population.
Picking a Brand of Trap • Comparisons depend on age of traps, service, pressure, etc. • It’s difficult to compare database data and come up with meaningful conclusions as to whether one brand is better than another. If one brand is older than another, it may fail more often. • Side-by-side comparisons are best. • Also, mean time between failures for each brand and model number at various pressures and services would be the best data.
Refinery’s Trap Recommendations • Use an Armstrong Universal Connector IS2 when replacing traps. (This speeds up future replacements.) • For all new 40, 65, and 150 psi mud legs or tracer traps use: • Armstrong 2010 or 2011 Inverted Bucket trap (first preference because they do not plug easily with fines). • For new 600+ psi steam traps choose: • Armstrong 2022 (first preference) • For process traps, consult the Energy Planner.
For More Information Contact Armstrong International, Inc. www.armstronginternational.com