Download
1 / 18
180 likes | 291 Views
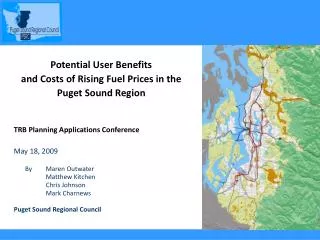
Potential User Benefits and Costs of Rising Fuel Prices in the Puget Sound Region. TRB Planning Applications Conference May 18, 2009 By Maren Outwater Matthew Kitchen Chris Johnson Mark Charnews Puget Sound Regional Council. Objective.

E N D
Potential User Benefits and Costs of Rising Fuel Prices in the Puget Sound Region TRB Planning Applications Conference May 18, 2009 By Maren Outwater Matthew Kitchen Chris Johnson Mark Charnews Puget Sound Regional Council
Objective • To Understand the Potential Impacts on Travel of Rising (and Falling) Gas Prices • Trips by type • Trip lengths • Mode choices • Vehicle miles traveled • To Measure the Potential User Benefits of Rising (and Falling) Gas Prices • Time and reliability savings • Costs • Emissions
Forecasting Vehicle Operating Costs • Definitions • Vehicle operating costs include fuel and maintenance costs • Effective vehicle operating costs accounts for the interaction between fuel costs and fleet efficiency • Assumptions • Future trends in fuel costs will affect average fleet efficiency • CAFÉ standards and other regulatory efforts will have an effect on new additions to the fleet, but average fuel efficiency trails standards significantly due to less efficient vehicles remaining in the fleet • Vehicle Classes • Autos and light trucks • Medium and heavy trucks
Forecast Trend in Fuel Costper Miles Traveled(Index Feb1987=1)
YearAutosTrucks Mid High Low Mid High Low 200615 15 15 78 78 78 203015 34 8 78 162 51 Operating costs in cents per mile (2000 dollars) Range of Operating Costsfor Sensitivity Testing
AlternativesLevel of Investment • Sensitivity Tests for • Baseline • Alt 1 • Alt 5
Comparative Analysis • Low and high auto operating costs were compared to the base alternative in each case: • Baseline – currently funded projects • Alternative 1 – emphasize efficiency through demand and system management projects • Alternative 5 – reduce emissions through limited highway improvements, significant transit improvements and regional tolling
Summary of ResultsElasticities with respect to Auto Operating Cost
Summary • Auto VMT and CO2 emissions have the highest decrease of all travel measures as gas prices increase. Truck VMT also decreases, but at a lower rate due to higher values of time. • Drive to transit, bike and walk trips have the highest increase of all measures as gas prices increase. Walk to transit trips are relatively inelastic. • Work trips made decrease as gas prices increase more than non-work trips.