Download

1 / 9
0 likes | 12 Views
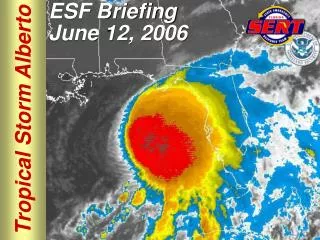
Tropical Storm Bertha, which formed in the Atlantic in 2014, exhibited disorganized characteristics that posed challenges for forecasters. High-resolution satellite imagery and Hydra software helped analyze its structure and potential hazards for aviation users, showcasing the importance of advanced tools in weather monitoring.

E N D
Observing Some of The Characteristics of Tropical Observing Some of The Characteristics of Tropical Storm Bertha, 2014 With the Use of Storm Bertha, 2014 With the Use of Hydra Software Hydra Software Lawrence Pologne Caribbean Institute for Meteorology and Hydrology April 29, 2016 UPRM
Introduction • Bertha was formed in the tropical Atlantic on early August 01, 2014 just east of Barbados under marginally favourable conditions (strong westerly shear and dry air entrainment) and thus struggled to maintain its surface circulation. • Uncertainty in positioning can lead to large errors in forecast tracks, putting lives and property at stake • This presentation aims to demonstrate that high resolution polar orbiting satellite imagery can be utilized to gain insight into disorganized weather systems such as Bertha. And ultimately, provide warnings to aviation users.
Data and Methodology • 10 km Modis data from the NASA EOS satellite DB system valid August 02, 2014; 0240z and 1455z. • Sounding data from Wyoming university website for 00z, 12z Aug 02, 2014. • Use of Hydra software to process the DB data.
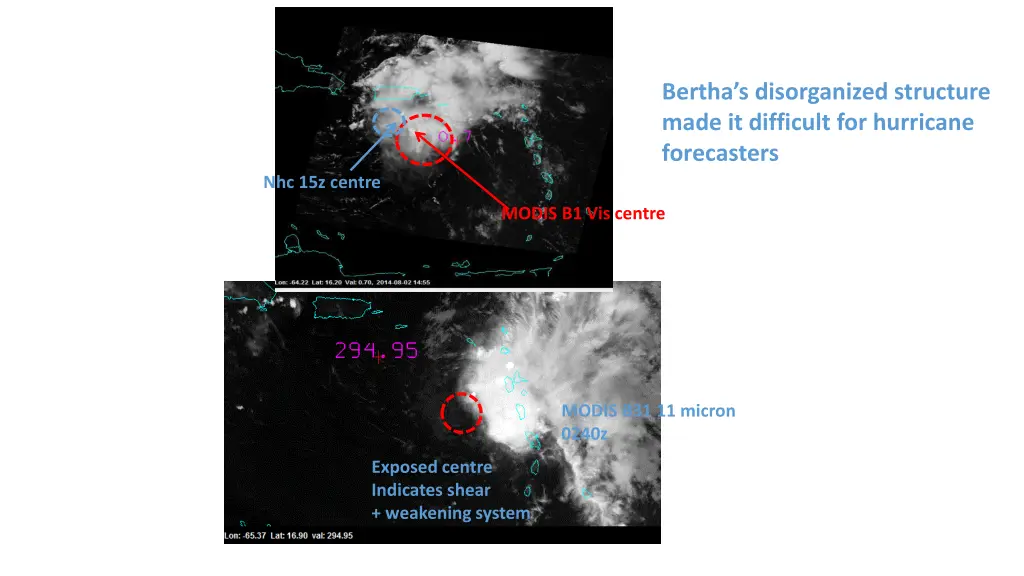
Bertha’s disorganized structure made it difficult for hurricane forecasters Nhc 15z centre MODIS B1 Vis centre MODIS B31 11 micron 0240z Exposed centre Indicates shear + weakening system
Cloud Water Path: A measure of total amount of liquid water between points in a column. Used to indicate dry air entrainment. Huge disparities in moisture content across storm

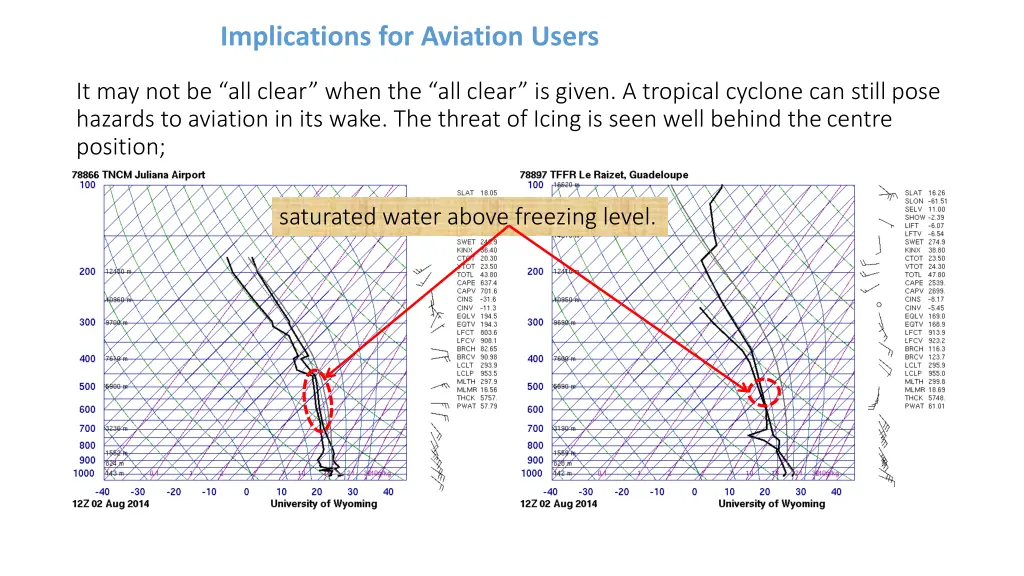
Implications for Aviation Users It may not be “all clear” when the “all clear” is given. A tropical cyclone can still pose hazards to aviation in its wake. The threat of Icing is seen well behind the centre position; saturated water above freezing level.
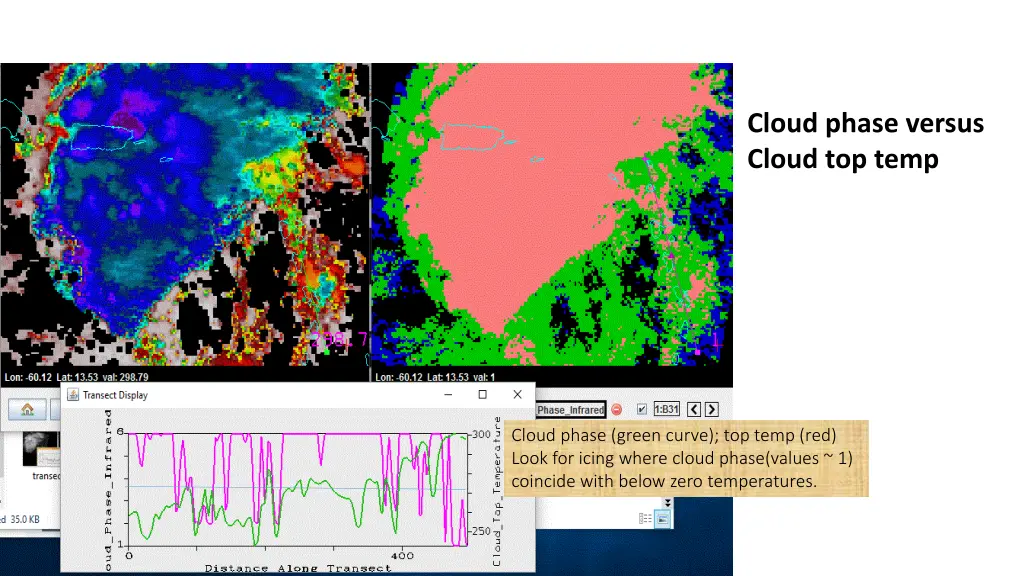
Cloud phase versus Cloud top temp Cloud phase (green curve); top temp (red) Look for icing where cloud phase(values ~ 1) coincide with below zero temperatures.
Conclusion • Hydra software can be utilized to investigate the structure of tropical cyclones; • The use of high resolution data from DB satellites can depict hazards pertinent to aviation users.
Acknowledgements • Many thanks to organizers: U. Wisconsin, NOAA, CIRA • Fcilitators: Kathy, Liam, Jessica for their patience and willingness to help • Host: Raphael for the good lunch • Co-attendants: for their cooperation and helpfulness • Looking forward for continued collaboration and I will be imparting what I acquired out of workshop onto my research work and teaching at the Caribbean Institute for Meteorology, Barbados. •Thank You ???