Download
1 / 15
150 likes | 166 Views
This map illustrates the levels of segregation between different racial groups in urban metropolises, focusing on black-white, Hispanic-white, and Asian-white segregation. It also compares the changes in segregation from 1990 to 2000.

E N D
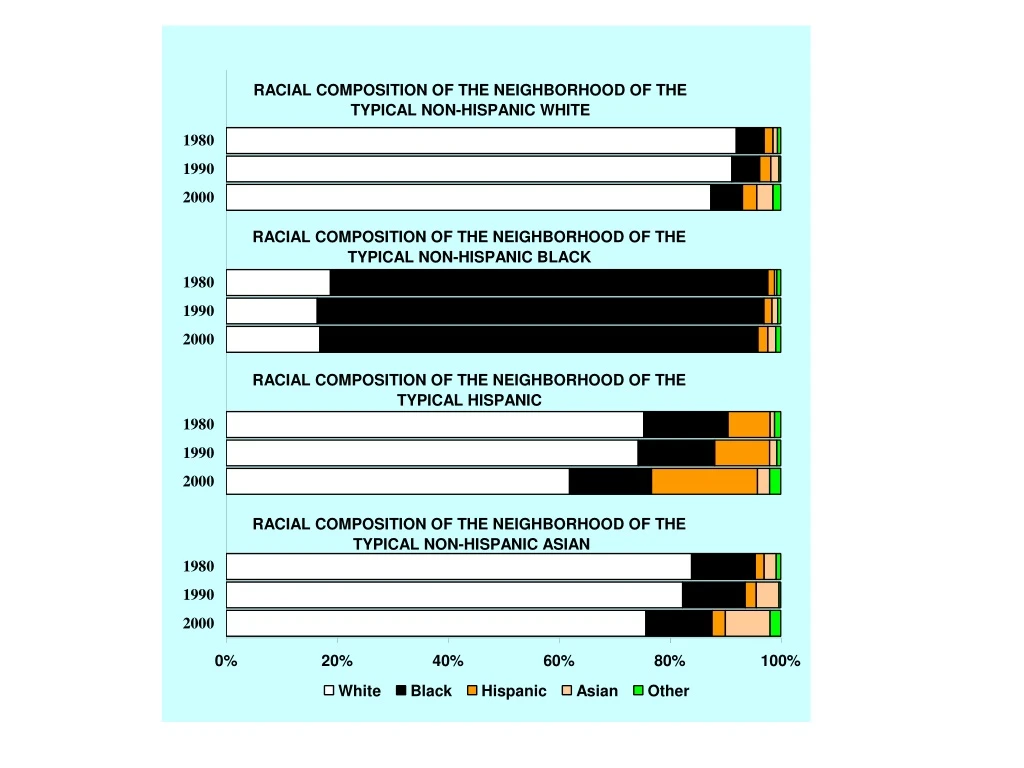
Tract > 75% White Tract > 75% Black Tract > 25% Hispanic Tract > 25% White and > 25% Black Tract has other racial composition
THE SEGREGATION OF BLACKS FROM WHITES THE SEGREGATION OF HISPANICS FROM WHITES THE SEGREGATION OF ASIANS FROM WHITES THE SEGREGATION OF HISPANICS FROM BLACKS THE SEGREGATION OF ASIANS FROM BLACKS THE SEGREGATION OF BLACKS FROM WHITES THE SEGREGATION OF HISPANICS FROM WHITES THE SEGREGATION OF ASIANS FROM WHITES THE SEGREGATION OF HISPANICS FROM BLACKS THE SEGREGATION OF ASIANS FROM BLACKS
BLACK - WHITE RESIDENTIAL SEGREGATION Number of Metropolises Index of Dissimilarity 76 Less than 40 76 40 to 50 83 50 to 60 96 Greater than 60 HISPANIC - WHITE RESIDENTIAL SEGREGATION Number of Metropolises Index of Dissimilarity 183 Less than 40 87 40 to 50 45 50 to 60 16 Greater than 60 ASIAN - WHITE RESIDENTIAL SEGREGATION Number of Metropolises Index of Dissimilarity 231 Less than 40 91 40 to 50 9 50 to 60 0 50 to 60 96 Greater than 60
PERCENT CHANGEIN SEGREGATION1990 to 2000 POPULATION(000) METROPOLIS INDEX OF DISSIMILARITY MEASURINGBLACK-WHITE SEGREGATION 1900 TO 2000 METROPOLIS POPULATION (000) INDEX OF DISSIMILARITY MEASURING BLACK-WHITE SEGREGATION INDEX OF DISSIMILARITY MEASURING BLACK-WHITE SEGREGATION