Download
1 / 25
250 likes | 276 Views
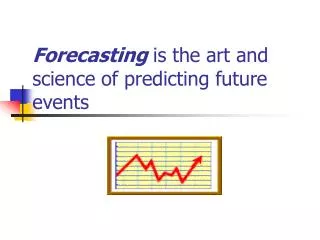
Learn the art and limitations of accurate forecasting in this seminar outlining the significance of precise forecasting, driving factors for efficiency, short- and long-term metrics, sales lift estimation, and more. Discover methods to improve your forecasting accuracy and tackle challenges in short-term predictions, leveraging a multi-model approach to enhance results with a focus on SARIMA model for long-term trends. Uncover valuable lessons and strategies to optimize your forecasting models effectively.

E N D
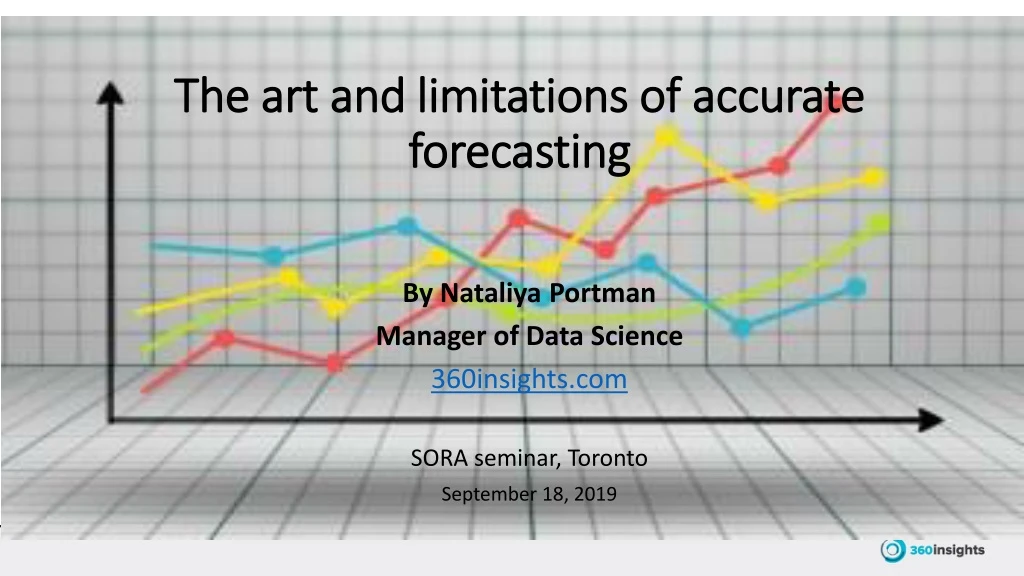
The art and limitations of accurate forecasting By Nataliya Portman Manager of Data Science 360insights.com SORA seminar, Toronto September 18, 2019
Outline • Why accuracy of forecasting matters • Driving factors of efficient and accurate forecasting • Short- and long-term forecasting of target KPI metrics • Estimation of sales lift due to promotional programs • Prediction of reward winners based on purchasing behaviour analysis • Conclusions KPI – Key Performance Indicator
Why accuracy of forecasting matters • Effective investment (e.g., incentive) or inventory management • Alignment with go-to-market strategy • Business goal setting • Strategic planning to increase sales growth • Realistic expectations on sales team performance • Sales volume forecast by • Product type • Service/rebate program type • Dealer • Time period
Driving factors of efficient and accurate forecasting • Open-source and commercial technology Model registration and management Deployment Experimentation Data preparation Package the model Advanced Analytics database Model prototyping Data querying Deploy service Feature engineering Training, hyperparameter tuning Accuracy assessment (hold out method) Preprocessing Retrain and update models
Driving factors of efficient and accurate forecasting • Methodology as a result of experimentation that yields the most accurate KPI estimates Experimentation Application 1: Next quarter sales volume forecast weekly Build optimized seasonal ARIMA models of product sales volumes by rebate program Compute average value of model predictions per rebate program monthly quarterly Model prototyping Application 2: Rest of year incentive spend forecast at dealer level Feature engineering Buildoptimizedseasonal ARIMA models of total revenue New dealers: Build monthly moving average models Existing dealers: Build optimized monthly seasonal ARIMA models of % contribution to overall incentive expense Training, hyperparameter tuning Accuracy assessment (hold out method) Per dealer, compute 1. % accuracy, 2. Rest of year forecasted $ sales volume
Long- and short-term forecasting of target metrics Weekly sales • SARIMA (Seasonal Autoregressive Integrated Moving Average)-based sales volume models at different time scales capture multiple trends over time. • Weekly sales model is particularly useful for short-term forecasting. • It forecasts higher than usual sales volumes in the • last week of the quarter. Actual Forecasted Unit volume Monthly sales Quarterly Sales Q2 2019 Q2 2017 Q2 2018 Actual Unit volume Forecasted Forecasted Actual
Short-term forecasting challenges Client 1: Accurate scenario Client2: Forecast off Established dealers Established dealers • Spikes are not captured by the model • Contribution to these spikes comes from new dealers Forecasted Forecasted True True New dealers New dealers Client 2 forecasting error propagation Unit volume New dealers Error All dealers Established dealers All dealers All dealers Weeks of the year Weeks of the year Weeks of the year
SARIMA model hyperparameter optimization • SARIMA model hyperparameters: • trend (p, d, q) • p: Trend autoregressive order • d: Trend difference order • q: Trend moving average order • seasonal (P, D, Q, N) • P: Seasonal autoregressive order • D: Seasonal difference order • Q: Seasonal moving average order • N: Number of time steps for seasonal period • Optimal model discovery methods: • Grid Search • Set aside last few months of sales observations (ti+1, ti+2, …, ti+L) • For next month/week ti+1 , forecast sales volume Vi+1(p, d, q, P, D, Q, N) for each hyperparameter combination from S=[0, 1, 2] ✕[0, 1, 2] ✕ [0, 1, 2] ✕[0, 1, 2] ✕[0, 1, 2] ✕[0, 1, 2] ✕[0, 1, 2,…,52] (weekly scale) • Choose (p, d, q, P, D, Q, N)opt to minimize residual |Vi+L – V true i+L| • Use optimal hyperparameter set to forecast future time steps • AIC (Akaike Information Criterion)-based model selection • Generate all different combinations of (p, d, q) and (P, D, Q, N) • Calculate + 2 • Choose (p, d, q, P, D, Q, N)opt that minimizes AIC
Optimized SARIMA model accuracy Model accuracy =100% -MAPE=90.7% MAPE – mean absolute percentage error
Lessons from SARIMA forecasting • Methodology is the “master” of accuracy of prediction and technology is its “slave” • If seasonality and trend are inherent to the data, choose SARIMA model due to its capability to capture long-term trends and seasonal effects • Experiment with model building and leverage multiple models to achieve higher precision • Grid-search SARIMA hyperparameter space and discover which configuration works best • Long-term forecasting is limited in accuracy • Irrespective of temporal scale, SARIMA models cannot see too far into the future
Estimation of sales lift due to promotional programs • Sales promotion programs are aimed at • gaining market share from competitors, • grow sales of certain brands. Can we build predictive analytics tool that will help find the right levers to pull? Will future promotional program schedule achieve an increase in sales of targeted products? Program name Program B Program D Program A Program C Program E Program F Duration Brand Historic records SKUs Payout
SARIMAX model – what is under the hood? Exogenous variables SARIMA model Pythonic model setup dat model = sm.tsa.statespace.SARIMAX(dat, order=order, exog=exog, seasonal_order=seasonal_order, enforce_stationarity=True) model_f=model.fit(maxiter=500) predictions=model_f.forecast(steps=1,exog=exog_forecast) Time series training dataset How do we define exog_forecast array? exog
Experimentation with SARIMAX model Baseline forecast • Promotional programs incorporated into SARIMAX model as Boolean variables influence forecasted sales volume values • Expected sales lift is only observed if there is correlation relationship between promotional activities and increase in sales
Does SARIMAX model always work? Product 1 monthly sales • Program activation Sales growth “Burn and Earn” program activity periods -
Lessons from SARIMAX forecasting • Inclusion of exogenous variables (representing promotional programs) allows to gain insights into future impact of promotional program and product choices on sales performance • If there is no correlation between selected product sales increase and marketing activities, then the model is unlikely to forecast positive sales lift • A powerful sales lift estimation tool can be created that would • (1) enable understanding of historic relationships between sales and promotional events and future • effect on sales of targeted products • (2) and lead to smart planning of the promotional program schedule
Purchasing behavior analysis and prediction of reward winners 4 levels of dealer incentives Trip to Mexico reward conditions (based on projected annual purchase quantities): Silver 240 annual units (120 qualifying) • New and silver/gold dealers • Purchase 1,600 units (800 qualifying) • Existing dealers • Achieve your levels • Meet or exceed last year’s total units • Platinum: Grow in 2019 by 250 qualifying units vs 2018 • Diamond: Grow in 2019 by 250 qualifying units vs 2018 Gold 700 annual units (350 qualifying) Platinum 1600 annual units (800 qualifying) 2400 annual units (1200 qualifying) Diamond • Business problem: • Estimate number of dealers who are likely to win the trip for accommodation arrangement • Make other dealers aware how far away they are from winning the trip • Solution: Forecast annual purchase unit volumes for all dealers and potential candidates to winners
Learning dealer purchasing patterns from historic data Recurring pattern with varying spike height Recurring pattern with increasing trend Purchased unit quantity month month Random pattern Steady pattern with isolated spike Purchased unit quantity month month
Accuracy estimation and interpretation • Lower accuracy wider variability range of forecasted volume • MAPE average % error per time step • Estimation result has to reflect uncertainty • To incorporate uncertainty into forecast we deduce lower and upper forecasted amounts from MAPE Roll 4 months back in time,, , Fit SARIMA model to all data points up to time and forecast volumes , MAPE Compute MAPE Compute accuracy
Decision making on trip winners Per dealer, compute 1. Accuracy, 2. Rest of year forecasted unit volume, 3. Lower and upper bounds, 4. 2018 qualifying unit volume Use forecasted range to decide on dealers who are likely to meet conditions of trip reward Build forecasting models of qualifying unit volumes per dealer Yes • New and silver/gold dealers • Purchase 1,600 units (800 qualifying) • Existing dealers • Achieve your levels • Meet or exceed last year’s total units • Platinum: Grow in 2019 by 250 qualifying units vs 2018 • Diamond: Grow in 2019 by 250 qualifying units vs 2018 Check if 2018 volume falls within forecasted range Check if target difference (250 or 100 units) is within (upper bound-2018 volume) and (lower bound -2018 volume) Platinum/diamond Existing dealers Gold/ Sapphire Check if 1600 units fall within forecasted range No Yes No Yes Unlikely to win Likely to win with % Acc Exceptional case: The predictive model returns NaN value which means that the algorithm failed to converge. Such dealers are classified to uncertainty group.
Ranking of dealers by certainty degree Outside of forecasted range Projected to win with 77.3% accuracy
Lessons from purchasing behavior forecasting • Repeated patterns in purchasing behavior are essential to reliable forecasting • Presence of sporadic spikes or dips hampers forecasting accuracy • Future uncertainty is inherent to forecasting and important to assess for informed decision making • The uncertainty is integrated into forecasted range of real values • 90% (95%) prediction intervals derived from SARIMA models are too wide that renders them impractical • Model accuracy estimated using MAPE gives idea of uncertainty extent • Lower and upper purchased amounts calculated from MAPE provide desired forecasted range • MAPE-based range forecast allows to check if dealer is likely to hit targeted purchase quantity • Dealers projected to win are ranked according to model accuracy