
Low Vision Mapping
E N D
Presentation Transcript
Low Vision Mapping Jill Keeffe and Peggy Chiang
Aims of study • To understand the current situation of low vision services throughout the world(What, where, who, and how services are delivered) • Identify the critical success factors associated with coverage of low vision services (key attributes that ensure comprehensive low vision service coverage) • This research will be used to inform the WHO Low Vision Working Group and Vision 2020 (provide priority areas to ensure comprehensive coverage)
Survey themes
Equipment • Devices available as part of low vision services- 88%(84/95) • Supply source of affordable low vision devices- 65% (55/84) • Reasons that individuals do not obtain low vision devices:
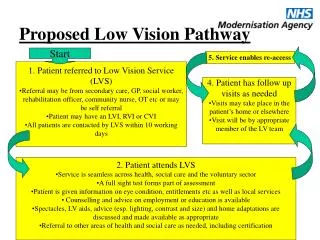
Barriers to access Other: lack of awareness, lack of services, poor referral pathways, logistics
80% of countries have ≤10% coverage Low vision service coverage No information No services provided ≤10% 11-50% >50%
Summary Funding - lobbying the government for ownership, funding mix, national budget & insurance to include low vision (example Cameroon vs. India) Rehabilitation workers – primary level care i.e. outreach & community based rehabilitation services by mid level ophthalmic personnel, HR training, task shifting Access - government awareness & acceptance, intervention timing, social welfare services, community & family support, Multidisciplinary services – clinical, education, rehabilitation, comprehensive services integrated with government and other existing services, integration of low vision curriculum into ophthalmic personnel training External contextual factors – government policy, distribution of resources in urban and rural settings, appropriateness of intervention
Mapping national services • Prevalence in adults from surveys • Children: WHO estimates using <5MR • Number of HR by cadre – clinical and rehabilitation • Availability of range of devices • Under-served groups