Download
1 / 29
290 likes | 310 Views
Federal and state funding for education has been consistently falling, leading to significant impacts on students and schools. This article explores the decline in education funding and its consequences.

E N D
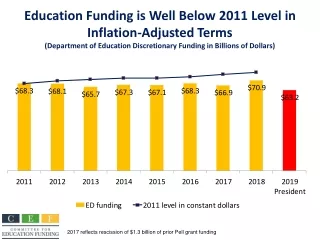
Education Funding is Well Below 2011 Level in Inflation-Adjusted Terms (Department of Education Discretionary Funding in Billions of Dollars) 2017 reflects rescission of $1.3 billion of prior Pell grant funding
President’s 2019 Education Budget is Below 2003 Level Excluding Pell GrantsDepartment of Education discretionary funding in billions Source: CEF calculations based on Department of Education budget tables: 2017 reflects rescission of prior Pell Grant funding
Education Accounts for Less Than 2% of All Federal Spending SOURCE: CEF based on FY2019 OMB Budget
President Trump’s Budgets Request Largest Education Cuts Requested change in Dept. of Education discretionary funding vs. prior year, in billions Reagan Does not include FY 2010 request versus FY 2009, which included $97 billion in Recovery Act funds, or FY 2011 request that requested all Pell grant resources as mandatory spending. FY 2019 request versus FY 2017 enacted. Source: Department of Education 2019 request and budget history tables
President’s 2019 Education Budget Far Below 2010 Level Excluding Pell Grants(Department of Education discretionary funds in billions)
Federal Funding Flat for 10 Years Across Education Continuum Except for Pell Grants(Discretionary dollars, in billions) Elementary and Secondary
President’s FY 2019 Education Department Discretionary Funding Source: CEF based on Education Department data
President Slashes 2019 Non-Defense Discretionary Spending to Well Below the Cap Budget Control Act Caps (in billions) Sequester Caps
President’s FY 2019 Budget Cuts Non-Defense Discretionary (NDD) Funding Below 2018 and 2019 Levels in Budget Deal(in billions) Source: Committee for Education Funding, 2/12/18
60% of Public Wants to Increase Federal Education Investment
Head Start Funding Provides Services to Fewer Than 4 of Every 10 Eligible Children 31% of eligible children ages 3 - 5 had access to Head Start 7% of eligible children under 3 had access to Early Head Start Source: National Head Start Association, https://www.nhsa.org/facts
Federal Support for Public Elementary and Secondary Schools Declining in Real Terms FEDERAL SOURCE: National Center for Education Statistics, "National Public Education Financial Survey," 2003–04 through 2013–14. See Digest of Education Statistics 2016, table 235.10.
Per Student Public Education Spending Virtually Flat Since 2009
U.S. Public K-12 Enrollment Continuing to Rise, Private School Enrollment is Flat(Students in thousands) Data Source: NCES Digest of Education Statistics 2016, tables 203.10 and 205.10, https://nces.ed.gov/programs/digest/current_tables.asp
Maximum Pell Grant No Longer Covers Much of Average Cost of College Source: College Board
Number of Recipients by Federal Aid Program (with Average Aid Received), 2016-17 Source: The College Board, Trends in Student Aid 2017, Figure 6A.
Total Undergraduate Student Aid by Source and Type (in Billions), 2016-17 Source: The College Board, Trends in Student Aid 2017, Figure 2.
Total Grant Aid in 2016 Dollars by Source of Grant, 1996-97 to 2016-17 Source: The College Board, Trends in Student Aid 2017, Figure 3.
Federal Grants and Loans Account for Most of Financial Aid Average amount of financial aid awarded to first-time, full-time undergraduate students awarded financial aid at 4-year degree-granting postsecondary institutions in academic year 2014-15 SOURCE: National Center for Education Statistics, Digest of Education Statistics 2016, table 331.20.
Total Annual Amount Borrowed in Federal Subsidized, Unsubsidized, and PLUS Loans in Millions of 2016 Dollars Source: The College Board, Trends in Student Aid 2017, Figure 7A.
Most Pell Grant Recipients Attend Public Colleges Source: FY 2019 U.S. Department of Education Congressional Budget Justification, https://www2.ed.gov/about/overview/budget/budget19/justifications/index.html
Undergraduate Enrollment and Percentage of Students Receiving Pell Grants Source: The College Board, Trends in Student Aid 2017, Figure 15A.
State Funding for Preschool Below 2002 Level SOURCE: State of Preschool 2017: State Preschool Yearbook, The National Institute for Early Education Research, http://nieer.org/wp-content/uploads/2018/04/State-of-Preschool-2017-Full.pdf
State and Local Funding for K-12 Education Has Eroded, Still Below 2008 Level in Real Terms K-12 Funding Fell Sharply After Recession HitChange in funding per pupil compared to 2008, inflation adjusted
Progress: Results for Students MORE HISPANIC AND AFRICAN-AMERICAN STUDENTS GRADUATING High school dropout rates: school years 2002 through 2015 SOURCE: U.S. Department of Education, National Center for Education Statistics, Digest of Education Statistics, 2016 Table 219.70
EDUCATION PAYS: More Education Leads to Higher Wages and Employment
Total and Per-Student State and Local Funding for Higher Education in 2014 Dollars and Public FTE Enrollment 1985-86 to 2015-16 SOURCE: The College Board, Trends in College Pricing 2017, Figure 12B.
Maximum Pell Grant Has Lost Value in Real Terms (Maximum and Average Award in 2016 Dollars) SOURCE: The College Board, Trends in Student Aid 2017, Figure 16.
Percentage of First-time, Full-time Undergraduate Students Awarded Grants and Loans at 4-year Degree-granting Postsecondary Institutions Academic Year 2014-2015 SOURCE: U.S. Department of Education, National Center for Education Statistics,Integrated Postsecondary Education Data System (IPEDS), Winter 2015–16, Student Financial Aid component. See Digest of Education Statistics 2016, table 331.20.