Download
1 / 41
410 likes | 576 Views
OUTCOMES. Engagement results in achievement Valentine Article—2 activities: 1 st Paragraph Importance of 3 words Partners, read Compare Contrast Graphic Organizer Valentine Process—activity: Highlight current practices on the Valentine Collaborative Study Sheet

E N D
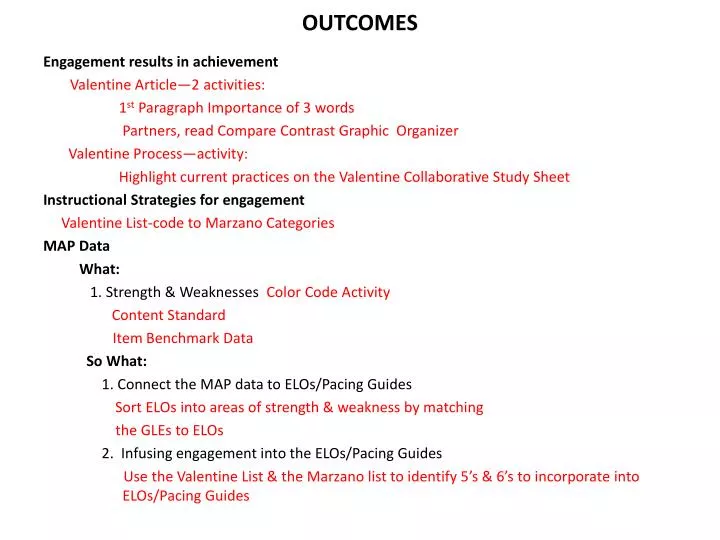
OUTCOMES Engagement results in achievement Valentine Article—2 activities: 1st Paragraph Importance of 3 words Partners, read Compare Contrast Graphic Organizer Valentine Process—activity: Highlight current practices on the Valentine Collaborative Study Sheet Instructional Strategies for engagement Valentine List-code to Marzano Categories MAP Data What: 1. Strength & Weaknesses Color Code Activity Content Standard Item Benchmark Data So What: 1. Connect the MAP data to ELOs/Pacing Guides Sort ELOs into areas of strength & weakness by matching the GLEs to ELOs 2. Infusing engagement into the ELOs/Pacing Guides Use the Valentine List & the Marzano list to identify 5’s & 6’s to incorporate into ELOs/Pacing Guides
PRODUCTS TO TURN in END OF Day • Make notes on the Plan of Action • Evaluate 2010 SMART Goals • Develop 2011 SMART Goals (develop these from the notes on the Plan of Action) --Do you want a SMART Goal around IPI 5 & 6 Codes? • Be sure to include PD needs • Monthly PLC Log
Welcome • Good Morning!!! • Enjoy some refreshments.
Origami Warm UP MATERIALS: Distribute 1 sheet of paper per participant ACTIVITY: Follow my instructions to fold a sheet of paper while keeping your eyes closed. DIRECTIONS: No questions, no talking • Fold your paper in half. • Now, fold it in half again. • Then, fold it in half one more time. • Now, rip off the right corner • Turn your paper over and rip off the upper corner
Processing Warm Up • Unfold your paper, did everyone come up with the same end result? Why or why not? • How would the results have been different if your eyes were left open? • What connections can you make to this activity? What implications are there?
Goals for the Day • What do you want to know from the data? • What outcome do you want from today and Monday?
Achievement Level Data If you do what you’ve always done, You’ll get what you’ve always got. • Comparisons that might inform you: • District to State, • 2011 District to 2010 District, • Change in District to change in State. • Do you have all the data you need? • Do you know how to access it on SIS for the students you tested and the students you have this year.
Focus on Achievement On the back of your packet, jot down the factors that affect student achievement
IPI Research Summary A What affects student achievement? How are each of the following words important in the 1st paragraph of the IPI Research Summary Motivation Engagement Achievement
Relationship between Engagement, Motivation, and Achievement Student Engagement Student Motivation Student Achievement
fly IPI Research Summary (Valentine & Collins)
fly IPI Research Summary (Valentine & Collins) As engagement increases, achievement increases. Generally: 15-20% increase in Higher Order/Deeper engagement to a 2-3% increase in pass rate. Some cases: 20% HO/D to pass rate in 6% Comm. Arts, 7% Math Enhanced capacity of student to think, to learn how to learn, and to appreciate learning.
VALUE VALUE of IPI in the Lebanon School District: Findings affirm that when schools periodically ( 3 or 4 times a year) use whole-faculty and/or sub-group disaggregated methods of data study, engagement in higher-order/deeper learning experiences increase as a whole for the school and the resultant impact on school-wide student achievement is positive and strong.
Days of Lost Learning Time and Percent of IPI Total Disengagement This chart provides the opportunity to identify how many days of instruction are lost when students are not engaged in learning during scheduled learning time. This is in addition to the time at the beginning and end of class and transistions. 1 to 4 ratio of harm of a one to the good of 5/6
Valentine Study Process • Are we getting the results described in the summary? • Why or why not? • If we are getting the results in some areas but not others, there may be a need to start breaking out by grade/course and/or content.
Maximizing the USE of IPIOnly get the Achievement Results when the IPI process is followed entirely. • 4 times a year optimum (1 waste of time) • Study data IMMEDIATELY AFTER COLLECTED Small/Whole Group Discussion about the Following: • Was it a Typical Day? • Data Observations (Strengths/Areas of Concern) • Goals (Set & Monitor Specific Goals) • New Learning (Associated with Instruction) • Discuss the VALUE of the IPI process & analysis
Valentine Study ProcessOnly get the Achievement Results when the IPI process is followed entirely. PLAN OF ACTION What You Found • Jot down the current reality of processing IPI data in your building So What Will You Do About It? • Jot down the steps your building/PLC will begin to take regarding the complete implementation of the IPI Process.
Plan of Action Grade: Content:
Factors Influencing Achievement What Works in Schools Robert Marzano
School/Teacher Effects on Student Achievement for a Student Entering School at the 50th Percentile What Works in Schools by Robert Marzano 50th 3rd 37th 63rd 96th 78th
Constructive Classroom Engagement: Examples to Consider and Discuss Dr. Jerry Valentine Circle the ones you are currently doing. X the ones you can consider for your content Ask each grade/course/individual to share a strategy from the list they will consider using.
Plan of Action Grade: Content:
Data Prediction Activity Based on your knowledge of what you did in your PLC/classroom, what strengths do you expect to find in your data 1. 2. 3. 4. 5. Compare to the Content Standard Data: District to State District this year to District last year District for 2011 data, to the District for those same students in 2010 (their previous grade) You can look at your current year’s students too
IBD Data On the IBD Data Highlight: Strengths in green (75% & above) Areas of concerns in yellow (59% and below) For: • 1st the District • 2nd My Class Compare you to the district: If you are yellow and the district is green, look for assistance from your PLC. If you are green and the district is yellow, offer your ideas to your PLC
IBD Data Compare the DISTRICT to the STATE On the IBD Data Highlight: In the STATE column, highlight in pink/purple if the DISTRICT is lower than the STATE Are these areas of concern too?
Plan of Action Grade: Content:
Key Vocabulary • Essential Learner Outcomes: Identifies what the learner will know and be able to do by the end of the grade or course. • Pacing Guide: Time lines that show what each teaching team plans to cover over the course of a year and defines what it takes for a student to be proficient. • Achievement Level Descriptors: Identifies what students are expected to know and be able to do at each grade level to be proficient. • Proficiency Indicators: A statement that declares the measureable level of competency that is expected for an objective/ELO. • Item Benchmark Descriptors: An assessment report that reflect average scores by item for the state, district, and individual teachers.
Connecting Data to the Pacing Guide Sort the Pacing Guides into those with GLEs in areas of strength and those with areas of concern. You may tally strengths & weaknesses under the GLE in the ELO box On the pacing guide note the process standard(s)
Connecting Data to the Pacing Guide • AREAS OF STRENGTH: What did your PLC do? Was it a SMART goal? What were the 5’s & 6’s you did within that ELO
Connecting Data to the Pacing Guide AREAS OF CONCERN: What can be done differently? • Tie proficiency levels to instructional levels. • As a PLC develop 5’s & 6’s for areas of concern • Who in your grade/course/PLC was this area of concern a strength for—what did they do? • What areas need to be identified for future Professional Development?
Categories of Strategies that Work Marzano Classroom Instruction that Works
Plan of Action Grade: Content:
PRODUCTS TO TURN in END OF Day • Make notes on the Plan of Action • Evaluate 2010 SMART Goals • Develop 2011 SMART Goals (develop these from the notes on the Plan of Action) --Do you want a SMART Goal around IPI 5 & 6 Codes? • Be sure to include PD needs • Monthly PLC Log FOR VERTICAL TEAM WORK IN NOVEMBER: Identify/develop instructional strategies at 5’s & 6’s for ELOs that reflect areas of concern. Record on the back of each ELO.