Download
1 / 27
270 likes | 434 Views
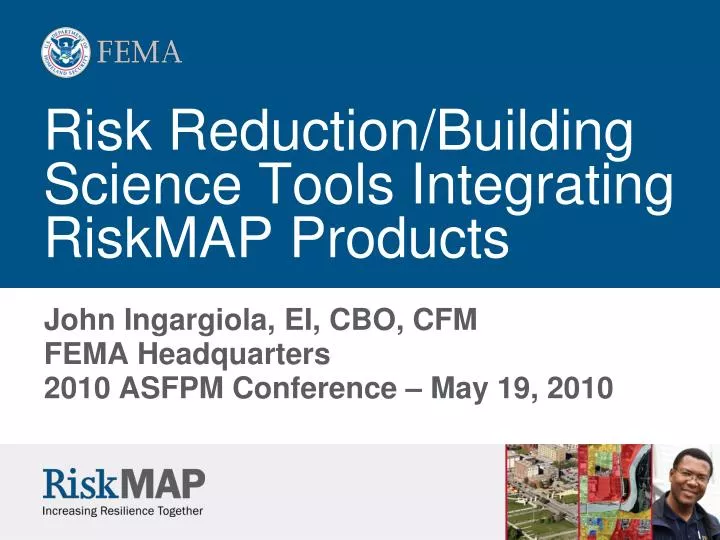
Risk Reduction/Building Science Tools Integrating RiskMAP Products. John Ingargiola, EI, CBO, CFM FEMA Headquarters 2010 ASFPM Conference – May 19, 2010. Presentation Outline. Background Building Science Technical White Paper Importance of Implementing Technical White Paper Conclusions .

E N D
Risk Reduction/Building Science Tools Integrating RiskMAP Products John Ingargiola, EI, CBO, CFM FEMA Headquarters2010 ASFPM Conference – May 19, 2010
Presentation Outline • Background • Building Science Technical White Paper • Importance of Implementing Technical White Paper • Conclusions
Background • FEMA initiated the Risk Mapping, Assessment, and Planning (Risk MAP) program to deliver data that leads to action that reduces risk to life and property. • Risk MAP goals align with the FEMA Building Science Branch’s promotion of a disaster resilient environment through technical guidance and tools that support mitigation solutions for buildings vulnerable to hazards. • Based on these potential synergies, the FEMA Building Science Branch proposed pilot concepts for Risk MAP. The most notable concept was to develop base flood velocity data for integration into DFIRM and FIS development.
Building Science Technical White Paper • In September 2009, FEMA Building Science submitted Technical White Paper on Feasibility for Providing Flow Depth and Velocity Data within FEMA 1%-Annual-Chance-Flood Special Flood Hazard Areas (SFHAs). • Technical White Paper objectives: • Utilize available research and FEMA FIS data on flood depth and velocity to better define flood risk to insured structures. • Provide data on flood depth and velocity to improve design, construction and permitting process for local officials so buildings are sited properly and designs correspond to the specific level of hazard.
Building Science Technical White Paper (cont’d) • Develop conceptual methodology using FEMA-accepted hydraulic models to estimate flood velocity risk to structures located within the SFHA. • Discuss methods to provide data to Mapping Partners and the public using the existing DFIRM (electronic mapping) and Internet. • Consider flood depth and velocity and other building damage parameters associated with coastal as well as riverine flood zones.
Importance of Implementing Technical White Paper • Determination of flood velocities is important for proper design of building foundations in the SFHA to resist flood damage. The following examples illustrate this point: • Velocity-depth damage relationships • Manufactured home foundation designs (FEMA P-85) • Case study scenarios showing impact of flood velocity on residential foundation design
Building collapse curves shown in Technical White Paper Figure A-1 based on FEMA-accepted hydraulic models (HEC-RAS) Such curves have been used to develop velocity-depth damage relationships for various types of buildings using a (D x V) factor These velocity-depth damage relationships have been converted to tables that are currently used in HAZUS (FEMA, 2009) Velocity-Depth Damage Relationships Figure A-1. Building Collapse Curves (CH2M HILL, 1974)
Manufactured Home Foundation Designs (FEMA P-85) • FEMA P-85 provides recommendations and prescriptive designs for manufactured home foundations as a function of flood zone and flood velocity • The foundation recommendations and prescriptive designs are based on engineering analysis as well as data from the following FEMA–led testing programs: • Full-scale ground anchor testing in dry and saturated soil conditions to determine anchor capacities • Laboratory flume tests of single and double dry-stacked and bonded piers to determine maximum velocity of 3-foot high piers
Manufactured Home Foundation Design Recommendations (cont’d)
Case Study Scenarios: Background – Design Flood Forces • Hydrostatic force (Fh): • Fh = ½ H2 b H Fh
Case Study Scenarios: Background – Design Flood Forces (cont’d) • Hydrodynamic force (Fdh): • Fdh = (dh) H b • where dh = CdV2/2g • (for V < 10 fps) Sources of data for determining flood flow velocity include hydraulic calculations, historical measurements, and rules of thumb. Overbank velocities are usually less than stream channel velocities. If no data for flood flow velocity exists in the Flood Insurance Study (FIS), contact an experienced hydrologist or hydraulic engineer familiar with local flooding conditions for estimates. - Source: FEMA 259 (Note) H V Fdh
Case Study Scenarios: Background – Design Flood Forces (cont’d) • Debris impact force (Fi): • Fi = π W Vb CI CO CD CB Rmax 2gt H Fi W V
Case Study Scenarios: Background • The following slides present 3 case study scenarios for residential buildings that will compute the following forces: • Lateral hydrostatic force (Fh) from standing water and saturated soil: • Hydrodynamic force (Fdh) from moving water as a function of velocity: • Impact force (Fi) from floodborne debris as a function of velocity: • The total design flood force (Fa) as a function of velocity: • Fa = Fh + Fdh + Fi
Case Study Scenario 1: Impact of Flood Velocity on Unvented Crawlspace • A one-story pre-FIRM, crawlspace home (60'L x 30'W) oriented long side parallel to flood flow is located in the flood fringe of an AE Zone and subject to riverine flooding. • BFE is 136 ft, FFE is 136 ft, ground surface elevation is 133 ft, and bottom of foundation elevation is 131 ft (all NGVD); there is no freeboard requirement. • Flood velocity is unknown, but is assumed to be between 2 and 10 feet per second (fps). • The impact force is based on a 1,000-lb object with CB of 1.0. • Calculate the total lateral design flood force on the unvented crawlspace foundation wall at the 100-year (base) flood based on flood flow velocities of 2, 4, 6, 8 and 10 fps. • Determine which CMU crawlspace wall designs may be used based on flood flow velocities of 2, 4, 6, 8 and 10 fps.
Case Study Scenario 1: Impact of Flood Velocity on Unvented Crawlspace (cont’d)
Case Study Scenario 1: Impact of Flood Velocity on Unvented Crawlspace (cont’d)
Case Study Scenario 2: Impact of Flood Velocity on Vented Crawlspace • A one-story post-FIRM, crawlspace home (60'L x 30'W) oriented long side parallel to flood flow is located in the flood fringe of an AE Zone and subject to riverine flooding. • BFE is 136 ft, FFE is 136 ft, ground surface elevation is 133 ft, and bottom of foundation elevation is 131 ft (all NGVD); there is no freeboard requirement. • Flood velocity is unknown, but is assumed to be between 2 and 10 feet per second (fps). • The impact force is based on a 1,000-lb object with CB of 1.0. • Calculate the total lateral design flood force on the vented crawlspace foundation wall at the 100-year (base) flood based on flood flow velocities of 2, 4, 6, 8 and 10 fps. • Determine which CMU crawlspace wall designs may be used based on flood flow velocities of 2, 4, 6, 8 and 10 fps.
Case Study Scenario 2: Impact of Flood Velocity on Vented Crawlspace (cont’d)
Case Study Scenario 2: Impact of Flood Velocity on Vented Crawlspace (cont’d)
Case Study Scenario 3: Impact of Flood Velocity on Pier Design • A post-FIRM one-story home (60'L x 30'W) oriented long side parallel to flood flow and supported by 28 piers is located in the flood fringe of an AE Zone and subject to riverine flooding. • BFE is 136 ft, the FFE is 136 ft, ground surface elevation is 133 ft, and bottom of foundation elevation is 131 ft (all NGVD); there is no freeboard requirement. • The flood velocity is unknown, but is assumed to be between 2 and 10 feet per second (fps). • The impact force is based on a 1,000-lb object with CB of1.0. • Calculate the total lateral design flood force on a single, 1 foot wide pier foundation at the 100-year (base) flood based on flood flow velocities of 2, 4, 6, 8 and 10 fps. • Determine which reinforced concrete pier designs may be used based on flood flow velocities of 2, 4, 6, 8 and 10 fps.
Case Study Scenario 3: Impact of Flood Velocity on Pier Design (cont’d)
Case Study Scenario 3: Impact of Flood Velocity on Pier Design (cont’d)
Conclusions • Design flood velocity has a significant impact on foundation design to resist flotation, collapse and lateral movement. • Risk MAP has allowed FEMA to create depth grids and provides an ideal opportunity to develop velocity grids. • Improved velocity data will allow designers to make better design and construction decisions for buildings in the floodplain. • Open foundations are subject to significantly less flood force than closed foundations. • The contribution of debris impact of 1,000 lb object does not generally control foundation design, but it can play a significant role. • FEMA 259 states use “hydraulic calculations, historical measurements, and rules of thumb.” and “contact an experienced hydrologist or hydraulic engineer familiar with local flooding conditions for estimates.” • WE CAN DO BETTER!WE DON’T HAVE TO GUESS ANYMORE!
Next Steps and Other Ideas • White Paper has being vetted, revised and endorsed by the Engineering & Mapping IPT. • White Paper is under consideration in the RiskMap Solution for standard products, enhanced products or both. • Piloting the integration of velocity data into the depth grids can test and validate the concept in the map study process and yield refinements to improve integration and minimize cost. • Match the best flood data (RiskMAP) with the best building codes (The International Codes and ASCE standards) for communities to act on. • Build on RiskMAP platform to communicate multi-hazard vulnerabilities (wind, wind-borne debris, seismic, tsunami, etc) with additional layers.
FEMA Flood-Wind Building Science Helpline E-mail: FEMA-buildingsciencehelp@dhs.gov Website: http://www.fema.gov/rebuild/buildingscience/ Phone: (866) 927-2104