Download
1 / 19
190 likes | 297 Views
This project investigates how galaxies look from various angles, utilizing large sky surveys to extract spatial information from spectra. The research focuses on inclination-dependent extinction, galaxy composition estimation, and N-D parameter estimation using spectroscopic and photometric data. Challenges in mapping spectra to physical parameters are addressed through PCA and catastrophe theory. The study aims to derive empirical galaxy spectra based on inclination, radius, and azimuth angle, enabling a deeper understanding of galaxy composition and dynamics.

E N D
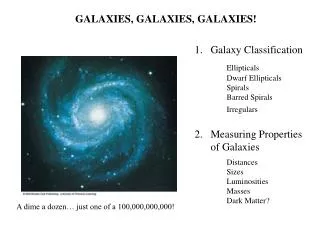
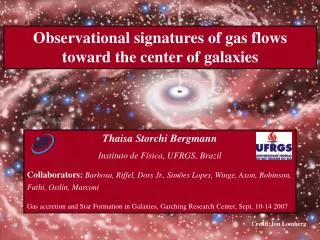
Toward 3D Spectra of Galaxies Ching-Wa Yip Johns Hopkins University
Collaborators • Alex Szalay (JHU) • Rosemary Wyse (JHU) • László Dobos (ELTE) • TamásBudavári (JHU) • IstvanCsabai (ELTE)
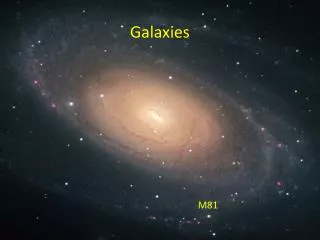
Question: how does a galaxy look like from various viewing angles? • We only see one side of a given galaxy • orbital period of Sun ~250 million years • Large sky surveys (SDSS; LAMOST) provide 106/107 galaxy spectra • Spectroscopic fiber projects fixed (3”) diameter area on the sky • Galaxies are inclined at various angles; and located at various distances • In principal we can statistically extract spatial information from the SDSS spectra
Comparison with Integral Field Spectroscopy (sometimes called “3D”) y x fλ(x, y, λ) Ealet et al. 2008
3D Spectrum fλ(x, y, z, λ) Line of sight q r f
Galaxies are at Different Inclinations (from SDSS Image Cutout tool)
Inclination Dependency of Average Spectrum Face-on galaxies Edge-on galaxies
Inclination-Dependent Extinction in Stellar Continuum Yip et al. 2009 submitted
Optical Thickness of Stellar Continuum of Galaxies Screen model Slab model Sandwich model θ Best-fit theoretical model is the slab model. Best-fit face-on extinction ~ 0.2 mag (SDSS g band).
Inclination Dependency of Extinction in HII Region (singly- ionized hydrogen) Theoretical, no dust value • Balmer decrement does not show inclination dependency. • HII region vs. Continuum-generating stars: • Different dust configuration and/or mechanism.
Overall model • Uniform mix of dust/stars • HII region outside of the mix O/B stars give arise to HII region: Balmer series hydrogen lines; [OIII] lines etc. Line of sight Low-mass stars give rise to stellar continuum (not to scale)
Galaxy Composition through N-D Parameter Estimation • N-D hypercube • Multi-linear interpolation to achieve arbitrary computational resolution in parameters 2-D: f(x, y) = f(x0, y0) * (dx0 * dy0) + f(x1, y1) * (dx1 * dy1) + f(x2, y2) * (dx2 * dy2) + f(x3, y3) * (dx3 * dy3) N-D: f(x) = ∑ f(zi) ∏ (1 – |xj - zij| ) whereziare the neighboring parameter points (x3, y3) (x2, y2) dy0 . Length = 1 (x, y) dx0 (x0, y0) (x1, y1)
N-D Parameter Estimation on SDSS Spectra • For 4D model (age, metallicity, star-forming time scale, extinction) • ~300,000 model spectra are generated on the fly • ~30 minutes (high resolution model + SDSS spectrum, 70km/s) • parameter uncertainties are estimated on object-to-object basis
N-D Parameter Estimation on Photometry • Stellar population and dust properties as a function of galaxy radius • Results support inside-out growth (Yip & Wyse 2009 in prep.) • Similar to tree-ring studies
N-D Parameter Estimation on Photometry • Stellar population and dust properties as a function of galaxy radius • Results support inside-out growth (Yip & Wyse 2009 in prep.) • Similar to tree-ring studies
Challenges Toward 3D Spectra • Spectrum as a function of galaxy radius • Galaxies from large surveys are located at various distances • Need to ensure we are comparing apples to apples • Spectrum as a function of φ angle • Need average spectrum for spiral arm, bar etc. • Galaxy Zoo images/results will be useful • Spectral analyses in 3D • Classification of galaxies • Diversity in galaxies • Composition modeling for stellar populations and dust
Challenges: Galaxy Composition • Fast Parameter Estimation • We would like to understand how spectra are mapped to the parameters • Data compression techniques (e.g., PCA) to reduce the dimensionality of spectra (Szalay) • Use Catastrophe theory (Szalay) • Parameter degeneracy is present (e.g., age-metallicity degeneracy) • Dealing with 105 or more model spectra • Store them in database to alleviate the need for interpolations • Difficulty: generality for complex models • Some spectral components (stellar bursts) are additive
How are spectra mapped to physical parameters • Principal Component Analysis (PCA) on model spectra to reduce their dimensionality • Expansion coefficients vs. parameters tell us about parameter degeneracy Yip & Szalay in progress
Summary • We have derived empirical galaxy spectrum as a function of inclination (θ), averaged over φ and projected radius < 0.5 half-light radius. • We will derive empirical galaxy spectrum as a function of both the radius (r) and azimuth angle (φ). • We have developed a N-D parameter estimation code for calculating the composition of galaxies (stars, gas & dust).