Download
1 / 23
230 likes | 372 Views
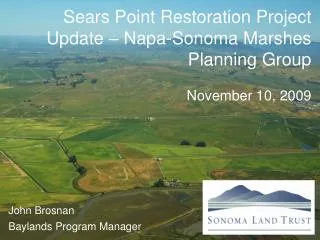
Bathymetric Surveys on Ponds 3, 4, & 5, Napa-Sonoma Marshes . U.S. Geological Survey John Y. Takekawa, Lacy M. Smith, & Nicole D. Athearn. Bathymetric Survey Overview. Goal: Document geomorphologic changes that have occurred since restoration of tidal flow

E N D
Bathymetric Surveys on Ponds 3, 4, & 5, Napa-Sonoma Marshes U.S. Geological Survey John Y. Takekawa, Lacy M. Smith, & Nicole D. Athearn
Bathymetric Survey Overview • Goal: Document geomorphologic changes that have occurred since restoration of tidal flow • New baseline data – Post-Breach Ponds 4 and 5 • Comparable data • Pond 3: 2001 (Towill) vs. 2009, 2001 vs. 2005, 2005 vs. 2009 • Ponds 4 & 5: 2001 (Towill) vs. 2009 • Additional mapping of original South Slough breach, all pond breaches, and pond islands.
Bathymetry Survey Methods RTK Antenna Console with laptop & RTK Transducer Pelican Case with Navisound
Bathymetry Survey Methods • 200 m East-West & North-South transects Pond 4 Pond 3
Bathymetry Survey Methods • South Slough and Breaches
Pond 3 ~ 2002 South Slough Breach • Mean elevation 2006: -3.122 ± 0.032 m (mean ± SE) NAVD 88 • Mean elevation 2009: -3.108 ± 0.031 m 2006 2009
Pond 3 ~ 2002 South Slough Breach • Net sediment gain of 46 m3 or a 1.4 cm thick layer across the area
South Slough • Mean elevation of South Slough region only: -2.85 ± 1.52 m
Pond 5 ~ Current Elevation • Mean elevation: 0.85 ± 0.003 m (mean ± SE) NAVD 88 • Elevation Range: -1.50 to 1.53 m
Pond 5 ~ 2001 - 2009 • 2001: 0.78 ± 0.003 m (mean ± SE) 2009: 0.85 ± 0.003 m
Pond 5 ~ Change in Elevation • Net sediment gain: 217,625 m3 • 7.6 cm layer of sediment throughout the pond
Pond 4 ~ Current Elevation • Mean elevation: 0.81 ± 0.004 m • Elevation Range: -2.1 to 1.97 m
Pond 4 ~ 2001 - 2009 • 2001: 0.82 ± 0.003m (mean ± SE) 2009: 0.81 ± 0.004m
Pond 4 ~ Change in Elevation • Net sediment gain: 19,700 m3 • 5.4 cm layer of sediment throughout the pond
Pond 3 ~ Current Elevation • Mean elevation: 1.05 ± 0.003 m • Elevation Range: -1.60 to 1.90 m
Pond 3 ~ 2001 to 2009 2001: 1.17 ± 0.002 m (mean ± SE) 2009: 1.05 ± 0.003 m
Pond 3 ~ Elevation Change 2001-2009 • Net sediment loss: 594,900 m3 • 12 cm layer of sediment throughout the pond
Pond 3 ~ 2005 - 2009 2005: 0.96 ± 0.002m (mean ± SE) 2009: 1.05 ± 0.003m
Pond 3 ~ Change in Elevation 05-09 • Net sediment gain: 473,800 m3 • 9 cm layer of sediment throughout the pond
Vegetation • See Google Earth
Future Research • Additional bathymetric surveys over time • Bathymetric survey on 9 & 10 • Aerial and Ground vegetation surveys • Elevation survey of colonizing plants • Continued monitoring of bird pond use
Acknowledgements • Funding provided by USGS and CA State Coastal Conservancy • Project support provided by: I. Woo, K. Spragens, K. Thorne, J. Shinn, A. Brand, K. Brailsford, C. Daggett, P. Gibson, T. Edgarian, S. Bishop, S. Piotter, K. Hirsch, and H. Haselbach


![[4] [5] [3] [2] [4]](https://cdn1.slideserve.com/2491770/slide1-dt.jpg)