Download
1 / 18
180 likes | 421 Views
The Bay Area Cultural Asset Map Visualizing the Big List. BACAM (Bay Area Cultural Asset Map). Commissioned by the Hewlett Foundation Created by Fractured Atlas Incorporates 2010 Bay Area Big List data 151 arts organizations 1.4 million attendance records, 642,000 unique names Objectives

E N D
BACAM (Bay Area Cultural Asset Map) • Commissioned by the Hewlett Foundation • Created by Fractured Atlas • Incorporates 2010 Bay Area Big List data • 151 arts organizations • 1.4 million attendance records, 642,000 unique names • Objectives • Research • Actionable visualizations • Effectiveness measurement
African-American Relative density of Af-Am arts attendees(all organizations) Density of African-American total population
Asian-American Relative density of As-Am arts attendees(all organizations) Density of Asian-American total population
Caucasian Relative density of Caucasian arts attendees(all organizations) Density of Caucasian total population
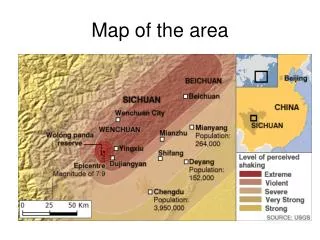
Types of conclusions we might draw • Generally, uniformly saturated at a high level among Caucasians (duh) • Relatively good saturation among Af-Am audiences in Bayview/Hunters Point and the Western Addition, but less so in outlying areas like the Sunset and the Richmond • Ditto with As-Am audiences in Chinatown, but less well-saturated in Outer Sunset/Richmond and towards South San Francisco
City Lights Theater Company • $500,000-$1,000,000 annual budget (midsize) • Located on South 2nd St, San Jose, relatively unappealing neighborhood • Relatively homogenous audiences • Relatively risky work (new work, adult themes, nudity, etc)
Zooming in on Audiences Understand the demographics of the region’s artsgoers See your demographic layout next to the entire artsgoing population Zoom in on your immediate area
City Lights Theater Company attendees Artsgoing population, entire Bay Area (all orgs)
Comparing Hispanic arts attendee populations Relative density of Hispanic arts attendees(all organizations) Relative density of Hispanic arts attendees(City Lights Theater Company)
Conclusions • As administrators, we need to make the Big List accessible • Visualization reveals trends that might otherwise go unnoticed • Maps make advocacy (and micro-advocacy) easier, more targeted • Data has to be re-incorporated every year (arduous process) • Implications for judging organization effectiveness • Future implications • Outplanting organizations? • Targeted funding? • Targeted ASO outreach?