Download
1 / 13
131 likes | 293 Views
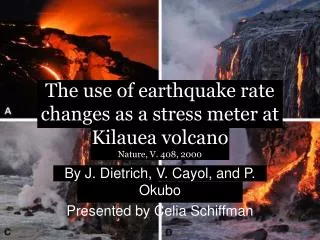
The use of earthquake rate changes as a stress meter at Kilauea volcano Nature, V. 408, 2000. By J. Dietrich, V. Cayol, and P. Okubo Presented by Celia Schiffman. Do changes in stress correlate with changes in earthquake rates?. Stress changes and EQ rates are not linearly correlated

E N D
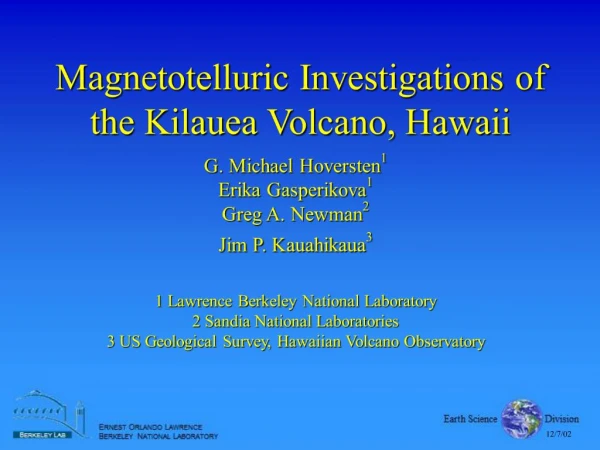
The use of earthquake rate changes as a stress meter at Kilauea volcanoNature, V. 408, 2000 By J. Dietrich, V. Cayol, and P. Okubo Presented by Celia Schiffman
Do changes in stress correlate with changes in earthquake rates? • Stress changes and EQ rates are not linearly correlated • EQ nucleation process is dependent on time and stress (lab. observations) • Estimating stresses that drive EQ’s versus stress changes resulting from EQ’s. • Kilauea: • Frequent stressing events • Independent observations of deformation • High rates of seismic activity • Changes in seismicity/eruptions/subsurface magma movement • Rift-zone magmatic expansion/detachment faulting
Formulas Stress step --> characteristic aftershock sequence (i.e. immediate jump in seismicity then decay according to Omori’s decay law [1/t])
Two methods to estimate stress change from EQ rates • Stress as a function of time in a specific volume -Calculate time series at grid points from earthquake rate data -Calculate stress changes over succesive time intervals using stress steps at the midpoint of each time interval
Two methods to estimate stress change from EQ rates 2) Spatial distribution of stress changes for a stress event (EQ or intrusion) -Use eq 1 to solve for constant stressing at Sr, take a stress step (corresponding to the stress event), then constant stressing at Sr again. -Eq counts are made for subregions sorted by fault orientation -6-13 km depths -Each volume needs at least 8 EQ’s -Grid nodes spaced 1 km apart
Timeline • Pre 1975: • Eruptive activity • 1975: • M7.2 EQ • 1975-1983: • Intrusion (1977) • Rapid deformation (up to 25 cm/yr extension) • Intense seismicity • Aseismic creep on detachment • Rift opening at 40 cm/yr • 1979-1983: • 5 fold slowing of stressing rates • 1983: • Eruption • Post 1983: • Nearly continuous rift eruption • Deformation decreased to 4 cm/yr
Observations Deformation data sets Number of earthquakes
Calculate stress changes based on eq’s -Eq rates are low-pass filtered -Assume Eq’s occur on faults that are optimally oriented in the stress field -Artifacts from random fluctuations in EQ rate and possible catalog inconsistencies during swarm events -Slowing of stressing rates from 1981-83 (0.3->0.15) Next: Compare to BEM’s constructed from independent estimates of stress changes
Pick best fitting values for variables based on deformation data Model variables: depth, height, width, dip and opening of dike Dip and depth of detachment fault Width of creeping portion of fault Outputs: Predicted surface deformations Stress changes
Boundary Element Models Pre-1983 eruption Post-1983 eruption
Problems • Non-linear relationship not clearly demonstrated • Is it really necessary? • Would a linear fit work just as well? • Need geodetic data (GPS) to better constrain changes in stress to see if step-function, or linear Statistics: Slope=1.1 Correlation=0.8