Download
1 / 7
70 likes | 224 Views
T02-01 Quick Graphs (Line Plot, Bar Graph, Pie Chart). Purpose Allows the analyst to create line plots, bar graphs and pie charts from data, which has previously been summarized, in a tabular summary format. Inputs Graph Title Categories Data

E N D
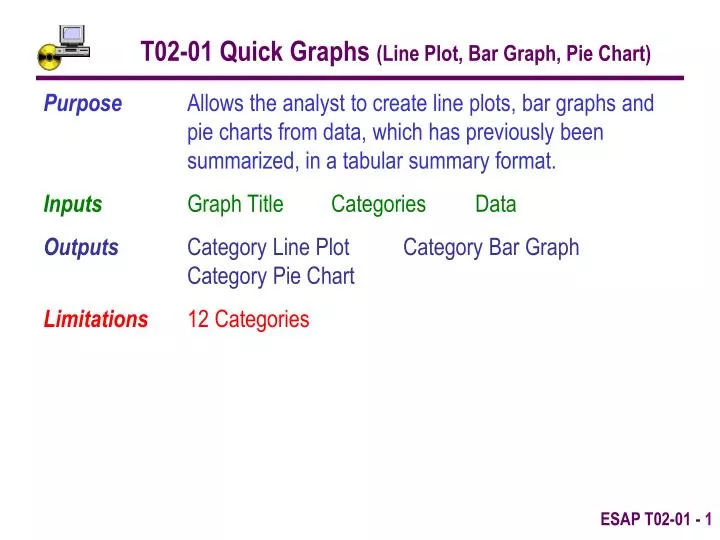
T02-01 Quick Graphs (Line Plot, Bar Graph, Pie Chart) Purpose Allows the analyst to create line plots, bar graphs and pie charts from data, which has previously been summarized, in a tabular summary format. Inputs Graph Title Categories Data Outputs Category Line Plot Category Bar Graph Category Pie Chart Limitations 12 Categories
T02-01 Quick Graphs (Line Plot, Bar Graph, Pie Chart) An Example A survey has produced the following tabular results. The analyst wants to view a graphic LinePlot, BarGraph, and PieChart of the Frequency shown in the tabular data.
The GraphTitle and CategoryLabels are entered in the bright green cells. The CategoryValues are entered in the light green cells.
WorksheetTabs can be selected to view the LinePlot, BarGraph & Pie Chart.
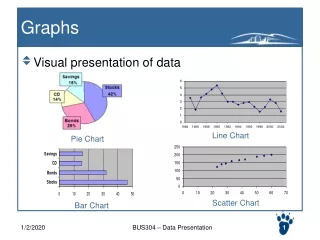
The Line Plot displays line representation for the CategoryValues
The Bar Graph displays a bar representation of the CategoryValues
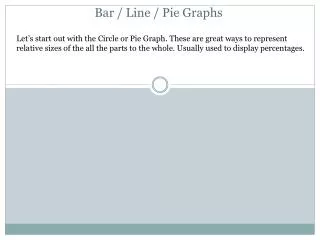
The Pie Chart displays a pie representation of the CategoryValues